Academic Research

Contextual Analysis In Sport Using Tracking Networks

Javier Martin Buldu is an expert on the analysis of non-linear systems and the understanding of how complex systems organise themselves, adapt and evolve. He focuses on the application of network science and complex systems theory in the analysis of sports. Buldu’s work is based on the principle that teams are far more than the simple aggregation of their individual players. By collaborating with organisations such as the Centre of Biomedical Technology in Madrid, La Liga, ESADE Business School, IFISC research institute and the ARAID Foundation, he has been able to combine elements of graph theory, non-linear dynamics, statistical physics, big data and neuroscience to construct various networks using positional tracking data of a football match. These networks are then able to explain what happens on the pitch beyond conventional ways of assessing the performance of individual players to understand team behaviours.

What Is Complex System Theory?

A complex system is a system composed by different parts that are connected and interact with one another. This system has properties and behaviours that cannot be explained by simply breaking down the system into its individual parts and analysing each individual part independently. For example, the human brain is a complex system and it has proven extremely challenging for scientists to fully understand how it performs all its functions, from how memory is stored to how cognition appears and disappears during certain illnesses. On the other hand, the human brain’s most fundamental component, the neuron, has been thoroughly studied and documented by science. Scientists have been able to recreate models and simulations of neuron behaviour, understand their shape and how they communicate with other neurons. However, this robust understanding of single neuron behaviour has not been sufficient to allow scientist to comprehend the interplay and interdependencies of the 80 billions neurons that form the human brain and that allows it to perform all of its complex behaviours. Instead, in order to appropriately study the brain, scientist need to pay attention to entire human cognitive system as a whole.

The idea behind complex systems like the human brain is what Buldu wanted to introduce in the analysis of football. While it is interesting to have information about isolated player performance, such as the number of shots, passes or successful dribbles, it is also important to understand the context in which these events take place. Additional insights on the performance of players and teams can be obtained by analysing information about how a player interacted with his teammates and the opposition’s players. Paying attention to individual player performances and aggregating those together is not enough to fully understand how a team behaves during a match.

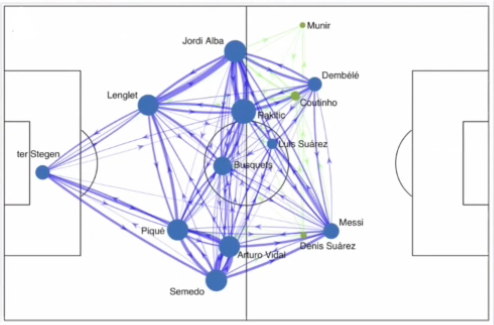
Instead, a complex system approach to football analysis would, for example, look at the link created between two or more players when they pass the ball between them. A network of these players can then be created by simply leveraging event data collected from notational video analysis to count the number of passes from player A to player B and vice versa. These types of passing networks are increasingly common in football match analysis and team reports, as they clearly illustrate information about how a team played during a match, where its players were most frequently located on the pitch and how they interacted with each other.

Passing Network between FC Barcelona players (Source: Javier Martin Buldu at FC Barcelona Sports Tomorrow)

Passing Network between FC Barcelona players (Source: Javier Martin Buldu at FC Barcelona Sports Tomorrow)

However, more complex and informative networks can be developed by leveraging positional tracking data instead of event data. While event data is generated through notational analysis by tagging specific actions, positional tracking data instead describes the position of the 22 players and the ball on the pitch at any moment in time during a match of football. Unfortunately, positional tracking data is challenging to access for most analysts. That is why Buldu collaborated with La Liga to obtain a positional tracking dataset containing Spanish football league matches. To capture this information, La Liga uses Mediacoach, a software that acquires the positional coordinates of players and the ball using a TRACAB optical video tracking system that requires the installations of specialised cameras across the football stadiums. Mediacoach’s system allows them to track a player’s position at 25 frames per second and a precision of 10cm. Thanks to this detailed tracking dataset received from La Liga, Buldu was able to explore the different interactions between players to construct a number of complex tracking networks in football. 

Proximity Networks

The first network that Buldu produced explored the proximity between players on the pitch. He first calculated an arbitrary 360 degrees distance around a player, let’s say a 5m radius, and used it as a threshold to identify any other players that may fall inside that particular player’s area. If another player was located inside of the first player’s surrounding area, a link was then created between those two players. If those two players were from the same team, a positive link was created, while if they were from opposing teams a negative link was assigned to that interaction instead. By increasing or decreasing the radius of the distance surrounding each player (i.e. 5m, 10m or 15m radius), Buldu produced different networks and links between players following this method.

Proximity radius at 5m, 10m and 15m showing links with players of the same team (green) and with opposing players (red) (Source: Javier Martin Buldu at FC Barcelona Sports Tomorrow)

Proximity radius at 5m, 10m and 15m showing links with players of the same team (green) and with opposing players (red) (Source: Javier Martin Buldu at FC Barcelona Sports Tomorrow)

The challenge of producing a variety of proximity networks is that they may prove difficult to analyse, as the links identified in a single video frame using a 5m radius around each player may be very different to those found using a 15m radius. On top of that, the analysis should look at how those proximity networks evolve over a number of frames during the match. In order to gather practical insights from these networks, Buldu aimed to study the number of positive and negative links for each of the teams, as well as the organisation of the proximity network structure, its temporal evolution and how they change in relation to the zone of the pitch and the various phases of the game.

Proximity analysis of the 3-player links for all players in a match between Atletico Madrid and Real Valladolid (Source: Javier Martin Buldu at FC Barcelona Sports Tomorrow)

Proximity analysis of the 3-player links for all players in a match between Atletico Madrid and Real Valladolid (Source: Javier Martin Buldu at FC Barcelona Sports Tomorrow)

He first counted the number of links between three different players forming a triangle. He then classified each triangle into two categories: positive (all players from the same team) or mixed triangles (at least one player from the opposing team). Buldu was then able to determine which team had dominance over the other at different times of the match by then counting the number of positive triangles and the number of mixed triangles produced with a certain threshold distance. The team with the the highest proportion of positive triangles (i.e. all three players in close proximity to each other forming a triangle were from the same team) was deemed to have been dominant over its opposition.

Marking Networks

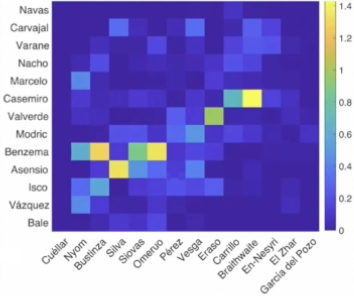
The second type of network that Buldu was able to construct with positional tracking data was the time a player was covering an opposing player during a defensive phase of play. Again, by setting an arbitrary threshold distance around a defender, a link between the defender and opposing player can be set by counting the time both players are in close proximity to one another. This process produces a matrix that illustrates the defenders on one of the axis and the attackers on the other axis, and provides a rough idea about the amount of time that each attacking player was being marked and by which defensive player. By interpreting the marking matrix analysts are able to identify the players with the highest accumulated time being marked by a defensive player.

Player marking matrix between Real Madrid (y-axis) and Leganes (x-axis) showing how often each Real Madrid players was marked by a Leganes player (Source: Javier Martin Buldu at FC Barcelona Sports Tomorrow)

Player marking matrix between Real Madrid (y-axis) and Leganes (x-axis) showing how often each Real Madrid players was marked by a Leganes player (Source: Javier Martin Buldu at FC Barcelona Sports Tomorrow)

Since matrices are the mathematical extraction of a network, this information can be drawn onto a diagram of a football pitch to plot the position of players during defensive actions. The size of each node in this network indicates the time an attacking player was being defended. By using these marking networks, analysts can clearly visualise the interactions and efforts of attacking and defending players during a match of football.

Player marking network between Real Madrid and Leganes (Source: Javier Martin Buldu at FC Barcelona Sports Tomorrow)

Player marking network between Real Madrid and Leganes (Source: Javier Martin Buldu at FC Barcelona Sports Tomorrow)

Coordination Networks

The third network that Buldu produced evaluated the coordination of movements between players of the same team. The network computed the velocity and direction of movement of two players to measure the alignment of their vectors. When this vector alignment was high, a high value link between these two players was created. When the alignment was low, a lower value connection was also derived from the two players’ movements. This method results in a matrix that illustrates how well players are coordinated with their own teammates. Two different matrices can be produced, one to analyse offensive phases of play and one for defensive phases.

Vector alignment of two attacking players (Source: Javier Martin Buldu at FC Barcelona Sports Tomorrow)

Vector alignment of two attacking players (Source: Javier Martin Buldu at FC Barcelona Sports Tomorrow)

Similarly to marking networks, coordination network matrices can also be translated into diagrams on a football pitch, where the nodes represent each player on the pitch while the size of each node indicates the amount of coordination the player has with the rest of his teammates. The links between two nodes also indicate the level of coordination between two particular players of the same team.

Movement coordination of each player with the rest of his teammates (Source: Javier Martin Buldu at FC Barcelona Sports Tomorrow)

Movement coordination of each player with the rest of his teammates (Source: Javier Martin Buldu at FC Barcelona Sports Tomorrow)

This type of analysis, especially when split between offensive and defensive players, can help analysts better understand the level of coordination between attack and defensive plays. For instance, an analyst or coach may want to see high degrees of coordination when the team defends as a block as well as how that coordination changes during the different phases of the game.

Ball Flow Networks

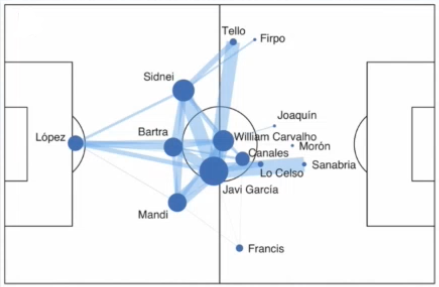
Lastly, the final network developed by Buldu focused on ball movement between different areas of the pitch. This network was produced by splitting the football pitch into different sections and counting the number of times the ball travelled from one section to another in order to create links between two different sections. This ball flow network can also be visualised on a diagram of a football pitch, with the nodes representing each section of the pitch and links indicating the number of times the ball moved from one section to the next. The size of these nodes indicate the amount of time the ball was being played inside that particular section of the pitch. By constructing an entire ball moving network during a match, analysts can then identify which are the most important sections of the pitch for their teams and assess how to exploit different sections in the opposition’s side in order to create dangerous opportunities.

Ball flow network for a match between FC Barcelona and Espanyol (Source: Javier Martin Buldu at FC Barcelona Sports Tomorrow)

Ball flow network for a match between FC Barcelona and Espanyol (Source: Javier Martin Buldu at FC Barcelona Sports Tomorrow)

Buldu’s work provides a great analytical framework to assess the complexities of sports in which a large diversity of factors can influence different outcomes of the game. It is crucial that when analysing a sport, all the available contextual information is analysed from various perspectives that can together provide a more complete evaluation of performance. Researchers, scientists and analysts are increasingly producing exciting work with positional tracking data that can open the door to new sophisticated methodologies and models to help coaches better understand the key influential factors of their team’s performance.

Further Reading:

  • Futbol y Redes Website

  • Buldu, J. M., Busquets, J., & Echegoyen, I. (2019). Defining a historic football team: Using Network Science to analyze Guardiola’s FC Barcelona. Scientific reports, 9(1), 1-14. Link to article.

  • Buldu, J. M., Busquets, J., Martínez, J. H., Herrera-Diestra, J. L., Echegoyen, I., Galeano, J., & Luque, J. (2018). Using network science to analyse football passing networks: Dynamics, space, time, and the multilayer nature of the game. Frontiers in psychology, 9, 1900. Link to article.

  • Garrido, D., Antequera, D. R., Busquets, J., Del Campo, R. L., Serra, R. R., Vielcazat, S. J., & Buldú, J. M. (2020). Consistency and identifiability of football teams: a network science perspective. Scientific reports, 10(1), 1-10. Link to article.

  • Herrera-Diestra, J. L., Echegoyen, I., Martínez, J. H., Garrido, D., Busquets, J., Io, F. S., & Buldú, J. M. (2020). Pitch networks reveal organizational and spatial patterns of Guardiola’s FC Barcelona. Chaos, Solitons & Fractals, 138, 109934. Link to article.

  • Martínez, J. H., Garrido, D., Herrera-Diestra, J. L., Busquets, J., Sevilla-Escoboza, R., & Buldú, J. M. (2020). Spatial and Temporal Entropies in the Spanish Football League: A Network Science Perspective. Entropy, 22(2), 172. Link to article.
History Of Performance Analysis: The Controversial Pioneer Charles Reep

Thorold Charles Reep was born in 1904 in the small town of Torpoint, Cornwall, on the south west of England. At the age of 24, he joined the English Royal Air Force to serve as an accountant, where he learned the necessary mathematical skills and attention to detail that he went on to employ throughout his career. During World War II, he was deployed in Germany, and would eventually be awarded the rank of Wing Commander.

Thorold Charles Reep (1904-2002) - Source: The Sun

Thorold Charles Reep (1904-2002) - Source: The Sun

From a young age, Reep was a faithful supporter of his local club Plymouth Argyle and would frequently attend matches at Home Park Stadium. However, his relocation to London after joining the Royal Air Force gave him an opportunity to attend Tottenham Hotspurs and Arsenal matches. In 1933, Arsenal’s captain Charles Jones came to Reep’s camp to talk about the analysis of wing play being used by the London club, which emphasise the objective of wide players to quickly move the ball up the pitch. The talk deeply inspired Reep, who soon became a keen enthusiast of Arsenal’s manager Herbert Chapman and his attacking style of football. This was the start of Reep’s passion for attacking football and its adoption across the country.

Arsenal FC 1933 squad including Herbert Chapman and Charles Jones - Source: Storie Di Calcio

Arsenal FC 1933 squad including Herbert Chapman and Charles Jones - Source: Storie Di Calcio

In March 1950, during a match between Swindon Town and Bristol Rovers at the County Ground, Reep became increasingly frustrated during the first half of the match by Swindon’s slow playing style and continuously inefficient scoring attempts. He took his notepad and pen out at half time and started recording some rudimentary actions, pitch positions and passing sequences with outcomes using a system that mixed symbols and notes to obtain a complete record of play. He wanted to better understand Swindon’s playing patterns and scoring performance and suggest any possible improvements needed to guarantee promotion. He ended up recording a total of 147 attacking plays by Swindon in that second half of their 1-0 win against Bristol.

Swindon Town vs Bristol Rovers 1950 Match Report - Source: Swindon Town FC

Using a simple extrapolation, Reep estimated that a full match of football would consist on an average of 280 attacking moves with an average of 2 goals scored per match. This indicated an average scoring conversion rate of only 0.71% per goal, suggesting only a small improvement was needed for a side to increase their average to 3 goals per game from just 2.

In the years that followed, Charles Reep quickly established himself as the first performance analyst in professional football, as he witnessed how the information he was collecting was being used to plan strategy and analyse team performance. He never stopped developing his theory of the game, watching and notating an average of 40 matches a season, taking him around 80 hours per match. He was often spotted recording match events from the stand at Plymouth's Home Park wearing a miner's helmet to illuminate his notebook, meticulously scribbling down play-by-play spatial data by hand.

In 1958, he attended the World Cup in Solna, near Stockholm, and produced a detailed record of the total number of goals scored, shots and possessions during the final. He wanted to provide an objective count of what took place in that match, away from opinions, biased recollections or a few single memorable events on the pitch. He produced a total of fifty pages of match drawings and feature dissection that took him over three months to complete.

Match between the domestic champions of England (Wolverhampton Wanderers) and Hungary league winners (Budapest Honved) in 1954. Stan Cullis declared his team as “champions of the world” after their 3-2 victory. This provoked a lot of criticism and i…

Match between the domestic champions of England (Wolverhampton Wanderers) and Hungary league winners (Budapest Honved) in 1954. Stan Cullis declared his team as “champions of the world” after their 3-2 victory. This provoked a lot of criticism and inspired the creation of the official European Cup the following season - Source: These Football Times

The real-time notational system Charles Reep developed took him to Brentford in 1951. Manager Jackie Gibbons offered him a part-time adviser position to help the struggling side avoid relegation from Second Division. With Reep’s help, Brentford managed to double their goals per match ratio and secure their Division spot by winning 13 of their last 14 matches.

The following season, his Royal Air Force duties moved Reep to Shropshire, near Birmingham. There he met Stan Cullis, at the time manager of the successful and exciting side Wolverhampton Wanderers. Cullis offered Charles Reep to take similar advisory responsibilities at his club to the ones he successfully undertook at Berntford. Reep not only brought with him his acquired knowledge from the analysis performed at Swindon and Brentford but also a innovative, real-time process that provided hand notations of every move of a football match, together with subsequent data transcription and analysis. As a strong believer of direct attacking football, Reep’s work only reinforced Cullis’ preestablished opinions of how the game should be played.

Stan Cullis, Wolverhampton Wanderers manager from 1948 to 1964 - Source: Solavanco

Stan Cullis, Wolverhampton Wanderers manager from 1948 to 1964 - Source: Solavanco

In his three and a half years at Wolves, Reep helped the club implement a direct, incisive style of play that consisted of very few aesthetics (i.e. skill moves) but instead took advantage of straightforward, fast wingers. Square passing by Wolves players became frowned upon by Cullis and the coaching team. During this time, the concept of Position of Maximum Advantage (POMO) began to emerge, describing the area of the opposition’s box in which crossed should be directed to in order to increase the chances of scoring. Under the Reep-Cullis partnership, Wolves achieved European success in what was then the European Champions Cup competition.

In 1955, Charles Reep retired from the Royal Air Force and was offered £750 for a one-year renewable contract by Sheffield Wednesday to work as an analyst alongside manager Eric Taylor. He ended up spending 3 years at Sheffield Wednesday, achieving promotion from Division Two in his first season at the club. On his final season at the club, his departure was triggered by the disappointing results by the team, and saw Reep point fingers at the club’s key player for refusing to buy into his long-ball playing system. During the remaining of his career, his direct involvement with clubs became a lot more sporadic. Nevertheless, he managed to help a total of twenty three managers from teams such as Wimbledon, Watford or even the Norwegian national team understand and adopt his football philosophy.

Over the years away from club roles, Charles Reep continued to investigate the relationships between passing movements, goals, games and championships, as well as the influence that random chance has on those variables. He was keen to continue to develop his theory by summarizing all his notes and records he had been collecting since 1950. During this analysis, Reep developed an interest in probability and the law of negative binomial, which he applied to his dataset. His analytical methods eventually became public after he shared his notes with News Chronicle and the magazine Match Analysis.

These publications demonstrated that Charles Reep had discovered insights of the game not previously analysed. Some of these suggested that teams usually scored on average one goal every nine shots or that half of the goals scored came from balls recovered in the last third of the pitch. One of his most famous remarks was to suggest that teams are more efficient when they reduce the time they spent passing the ball around and instead focus on lobbing the ball forward with as few number of passes as possible. He was a firm promoter of a quicker, more direct, long-ball playing style.

Reep followed a notational analysis method of dividing the pitch into four sections to identify a shooting area approximately 30 metres from the goal-line. This detailed in-event notation and post-event analysis enabled him to accurately measure the distance and trajectory of every pass. Amongst his findings, he discovered that:

  • It took 10 shots to get 1 goal

  • 50% of goals were scored from 0 or 1 passes

  • 80% of goals are scored within 3 or less passes

  • Regaining possession within the shooting area is a vital source of goal-scoring opportunities

  • 50% of goals come from breakdowns in a team’s own half of the pitch

In 1953, Reep went on to publish his statistical analysis of patterns of play in football in the Journal of the Royal Statistical Society. In his paper, he analysed 578 matches to assess the distribution of passing movements and found that 99% of all plays consisted of less than six passes, while 95% of them consisted of less than four. These findings backed Reep’s beliefs of reducing the frequency of passing and possession time by moving the ball forwards as quickly as possible. He wanted that the truth he had discovered dictated how teams play.

Manual notational analysis prior to the introduction of technology - Source: Keith Lyons

Manual notational analysis prior to the introduction of technology - Source: Keith Lyons

From his first analysis of the 1950 Swindon Town match against Bristol Rovers all the way to the mid-1990s, Charles Reep went on to notate and analyse a total of 2,200 matches. In 1973, Reep analysed England's 3-1 loss against West Germany in the 1972 European Championship to vigorously protest the “pointless sideways” passing style of play adopted by the Germans. In that match, the Germans had outplayed the English with a smooth, passing style of football that was labelled at the time as “total football”. Reep attempted to argue against the praise this new passing style of play had received across the continent by implying that it lacked the attractiveness demanded by fans as it placed goal scoring as a secondary objective in exchange for extreme elaboration of play. Instead, he pushed forward his own views regarding the use of long balls and suggested that, even though they less frequently found the aimed player, they brought unquestionable gains. He stated that, based on his analysis, the chance generation value of five long passes missed was equal to five of them made.

Swindon Town vs Bristol Rovers 1950 Programme - Source: Swindon Town FC

Swindon Town vs Bristol Rovers 1950 Programme - Source: Swindon Town FC

Most of Charles Reep’s analysis supported the effectiveness of using a direct style of football, with wingers as high up the pitch as possible waiting for long balls. This approach to the game a had significant influence in the English national team between the 1970s and 1980s, when the debate of the importance of possession had become the central topic of conversation amongst FA directors. Reep, often described as an imperious individual intolerant of criticism, argued against the need for ball possession, contrary to the philosophy backed by then FA’s technical director Allen Wade.

It was not until 1983, when Wade was replaced as technical director by his former assistant Charles Hughes – a strong believer of long ball play – that Reep’s direct football ideology became the new FA's explicit tactical philosophy of the English game. Hughes saw in Reep’s work an opportunity to redefine the outdated ideals of the amateur founders of the FA and introduce his own mandate across the whole English game. This mandate consisted on a style of play that focused on long diagonals and physicality of players. As a result, technically gifted midfielders found themselves watching how the ball flew over their heads as they struggled with overly physical challenges.

Charles Hughes, The FA’s former technical director of coaching - Source: The Times

Charles Hughes, The FA’s former technical director of coaching - Source: The Times

Controversy And Criticism

Charles Reep’s simplistic methods have been, and continue to be, critised by many football fans and analytics enthusiasts. One critic indicated that while his study assessing passing distribution showed that almost 92% of moves constituted of less than 3 passes, his dataset only contained 80% of the goals, and not 92%, from these short possessions. This contradicts Reep’s beliefs by illustrating that moves of 3 or fewer passes were in fact a less effective strategy to score goals. Additionally, it also demonstrated that Charles Reep’s argument that most goals happened after fewer than four pass movements was simply due to the fact that most movements in football (92% from his dataset) are short possessions, thus it would be understandable that most goals would be scored in that manner.

Similarly, his study did not appear to take into consideration differences in team quality. Evidence of this can be seen in that the World Cup matches he analysed, which contained double the amount of plays with seven or more passes than those he recorded from English league matches. The indication suggest that Reep missed the fact that a higher quality of the game in a higher level competition, such as the World Cup, with better players available, seemed to provide longer passing moves than in English football league matches where the average technical quality of players would be inferior. Furthermore, critics have also added that none of Reep’s analysis takes into consideration any additional factors to playing style, such as the level of exhaustion exerted on the opposition by forcing them to chase the ball around through passing.

Reep’s character and very strong preconceived notions could have prevented him from investigating alternative hypotheses that did not agree with his philosophy of direct football. He was often described as an absolutist that wanted to push his one generic winning formula. This caused most of Reep’s analysis to be ignorant of the numerous essential factors that can affect a match’s outcome. Critics have often labelled Reep’s influence on the philosophies applied to English football and coaching styles for over 30 years as “horrifying”, due the fundamental misinterpretations Reep committed throughout his work. As previously stated, one of these consisted on applying the same considerations and level of weighting to a match by an English Third Division team than to a match in the World Cup. He paid no attention to the quality of the teams involved, ignoring potentially valid assumptions that a technically poorer team may experience greater risks when attempting to play possession football. Instead, he followed his own preconceptions, such as assuming that teams should always be trying to score, when in reality teams may decide to defend their scoreline advantage by holding possession.

Aside from the criticism for his poor methods and misinterpreted finding, Reep has also been recognised for the new approaches he introduced to the analysis of the game. He was one of the first pioneers to show that football had constant and predictable patterns and that statistics give us a chance to identify what we would otherwise had missed. He initiated the thinking around the recreation of past performance through data collection, which could then inform strategies to achieve successful match outcomes. While he might not have been an outstanding data analyst, Charles Reep was a great accountant with great attention to detail and ability to collect data.

The approaches he introduced have significantly evolved since Reep’s first notational analysis in 1950. Technologies and analytical frameworks developed since the 1990s have facilitated the emergence of video analysis and data collection systems to improve athlete performance. From the foundation of Prozone in 1995 that offered high-quality video analysis to the appearance of Opta Sports or Statsbomb as global data providers capturing millions of data points per match, the field of notational and performance analysis in football has evolved in line with the technological revolution of the last few decades. The popularity of big data and the growing desire of data-driven objectivity has become important priorities within professional clubs when aiming to gain competitive advantage in a game of increasingly tight margins. Reep’s work initiated the machinery that is today an ecosystem of video analysis software, data providers, analysts, academia, data-influenced management decisions and redefined coaching processes that constitute a key piece of what modern football is today. While none of these elements can win a match on their own, they surely have been making crucial contributions in providing clubs with those smallest advantages that make the largest of differences.

Citations:

  • Instone, D. (2009). Reep: Visionary Or Detrimental Force? Spotlight On Man Whose Ideas Cullis Embraced. Wolves Heroes. Link.

  • Lyons, K. (2011). Goal Scoring in Association Football: Charles Reep. Keith Lyons Clyde Street. Link.

  • Medeiros, J. (2017). How data analytics killed the Premier League's long ball game. Wired. Link.

  • Menary, S. (2014). Maximum Opportunity; Was Charles Hughes a long-ball zealot, or pragmatist reacting to necessity? The Blizzard. The Football Quarterly. Link.

  • Pollard, R. (2002). Charles Reep (1904-2002): pioneer of notational and performance analysis in football. Journal of Sports Sciences, 20(10), 853-855. Link.

  • Pollard, R. (2019). Invalid Interpretation of Passing Sequence Data to Assess Team Performance in Football: Repairing the Tarnished Legacy of Charles Reep. The Open Sports Sciences Journal, 12, 17-21. Link.

  • Reep, C. & Benjamin, B. (1968). Skill and chance in association football. Journal of the Royal Statistical Society, 131, 581-585.

  • Sammonds, C. (2019). Charles Reep: Football Analytics’ Founding Father. How a former RAF Wing Commander set into motion football’s data revolution. Innovation Enterprise Channels. Link.

  • Sykes, J. & Paine, N. (2016). How One Man’s Bad Math Helped Ruin Decades Of English Soccer. FiveThirtyEight. Link.

Performance Indicators in Football

Micheal Hughes et al discussed in 2012 in their article "Moneyball and soccer - an analysis of the key performance indicators of elite male soccer players by position", how team sports like football offer an ideal scope for analysis thanks to the numerous factors and combinations, from individual to teams, that can be used to identify performance influencers.

READ HUGHES M.D. ET AL'S FULL ARTICLE HERE

The article suggests that, in a sport like football, in order for a team to be successful, each player must effectively undertake a specific role and a set of functions based on the position the play in on the field. Through a study carried out with 12 experts and 51 sport science students, they aimed to identify which are the most common performance indicators that should be evaluated in a player's performance based on their playing profile. They started by defining the following playing positions in football:

  • Goalkeeper

  • Full Back

  • Centre Back

  • Holding Midfilder

  • Attacking Midfilder

  • Wide Midfielder

  • Strikers

Each performance indicator identified by position would be then categorized into the following 5 categories:

  • Physiological

  • Tactical

  • Technical - Defensive

  • Technical - Attacking

  • Psychological

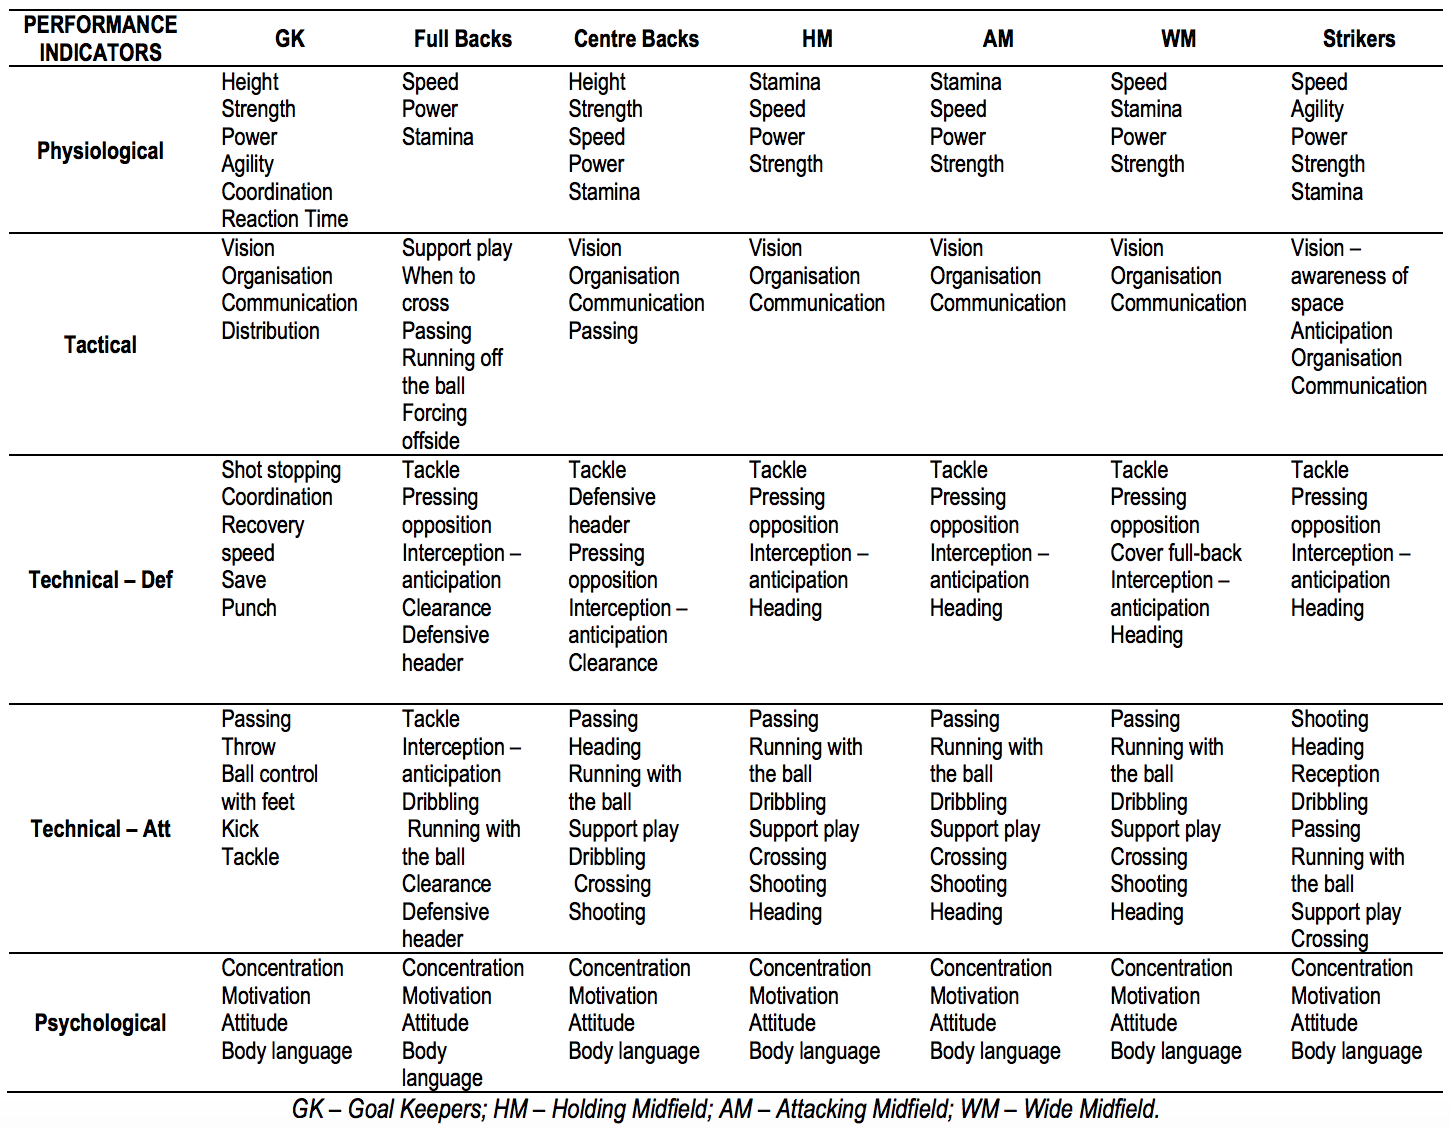
Through group discussions between the experts and the level 3 sport scientist, they came up with the following traits required for each of the above positions.

Source: Moneyball and soccer by Michael Hughes et al (2012)

Source: Moneyball and soccer by Michael Hughes et al (2012)

The study identified that most performance indicators of outfield players were the same across position, with only the order of priority of each PI varying by position. Only goalkeepers had a different set of PIs than any other position. While these classifications of skills by position were done in a subjective method (ie. group discussion), it is a good first step towards the creation of techno-tactical profiles based on the players position and functions on the field, as pointed out by Dufour in 1993 in his book 'Computer-assisted scouting in soccer'. The above table provides a framework in which coaches and analyst can further evaluate the performance of players in relation to their position. However, tactics and coaching styles or preferences may cause the order of priority of each PI within each category to vary by team. The article also suggests that a qualitative way of measuring the level of each performance indicator should be used to evaluate a particular player.

The above suggests that positions may play a key role when assessing performance in footbal. From a quantitative perspective, when analysing the performance indicators to determine success or failure, or even to establish a benchmark to which to aim for, there are several metrics an analyst will look to gather through notational analysis:

Technical:

  • Shooting game

    • Total number of goals

    • Total number of shots

    • Total number of shots on target

    • Total shot to goal scoring rate (%)

    • Total shot on target to goal scoring rate (%)

    • Shots to goal ratio

    • Shots on target to goal ratio

    • Total number of shots by shooting position (ie. inside the box)

    • Total number of shots by shot type (ie. header, set piece, right foot, etc.)

    • xG (read more)

  • Passing game

    • Total number of passes

    • Total pass completion rate (%)

    • Total number of short passes (under X metres away)

    • Total short pass completion rate (%)

    • Total number of long passes (over X metres away)

    • Total long pass completion rate (%)

    • Total number of passes above the ground

    • Total chip/cross pass completion rate (%)

    • Total number of passes into a particular zone (ie. 6 yard box)

    • Total zone pass completion rate (%)

    • Pass to Goal ratio

    • Total number of unsuccessful passes leading to turnovers (ie. interceptions)

    • Total pass turnover rate (%)

  • Defensive game

    • Total number tackles

    • Total number of tackles won

    • Total tackle success rate (%)

    • Total number of tackles in the defensive third zone

    • Total number of tackles won in the defensive third zone

    • Total number of fouls conceded

    • Total number of fouls conceded leading to goals conceded (after X minutes of play without possession)

    • Total number of pass interceptions won

    • Total number of possession turnovers won

Tactical:

  • Attacking

    • Total number of set pieces

    • Total number of attacking corners

    • Total number of free-kicks (on the attacking third zone)

    • Total number of counterattacks (ie. based on X number of passes between possession start in own half to shot)

    • Average duration of attacking play (from possession start to shot)

    • Average number of passes per goal

  • Possession

    • Total percentage of match possession (%)

    • Total percentage of match possession in opposition's half

    • Total percentage of match possession in own half

    • Total number of possessions

    • Total number of non-shooting turnovers

    • Ratio of possessions to goals

    • Total number of passes per possession

    • Total number of long passes per possession

    • Total number of short passes per possession

  • Defensive

    • Total number of clearances

    • Total number of offsides by opponent team

    • Total number of corners conceded

    • Total number of shots conceded

    • Total number of opposition's passes in defensive third zone

    • Total number of opposition's possessions entering the defensive third zone

    • Average duration of opposition's possession

It is important to note that teams may adapt both their tactics and style of play based of the various circumstances they face in a game. For example, a team scoring a winning goal in the last 10 minutes may chose to give up possession in order to sit back in their defensive third during the remaining of the game. When using quantitative analysis to determine the success or failure again the performance indicator, it is important to take context into consideration for a more complete and accurate analysis.

Notational analysis: a synonym of today's performance analysis

While motion analysis and biomechanics constitute important areas in performance analysis, one of the most popular and fundamental pieces of performance analysis in sport is the use of notational analysis. Notational analysis is the identification and analysis of critical patterns and events in a performance that lead to a successful outcome. Hughes (2004) defined notational analysis as "a procedure that could be used in any discipline that requires assessment and analysis of performance". The information used for notational analysis is usually gathered by observing a team's performance in a competitive environment. By notating numerous events that take place on the pitch, such as striker positioning, defenders' tackle success rate or midfielders pass completion rate, an analyst can identify strengths and weaknesses and provide these results to coaches who then use them to adapt training sessions or share accurate feedback with players and the entire team.

The importance of notational analysis comes from the limited recalling ability that coaches, as human beings, have when remembering specifics of the performance of their teams, and how these can be biased by their beliefs and other motives. As Hughes and Franks described, by receiving objective data of what happened during a game, a coach can make a more informed decision by enhancing his or her abilities to accurately assess the events of a game and improving the quality of feedback he is able to provide to the players. A big miss by a striker might be recalled by coaches and other players more vividly than the same's striker effective positioning or successful dribbling in the same game. At a professional level, we often hear pundits and fans rate a player's performance in a game based on a small number of noticeable actions that took place, such as a missed penalty or a defender's mistake that led to a one-on-one chance by the opposition team. However, through notational analysis, a more complete view of that player's performance may provide a more accurate perspective on the players contribution in the game and inform any future decisions towards that player, such as training structure or upcoming match presence.

Different teams in different sports will define their own frameworks of performance indicators that allows them to identify the areas in the game they are most interested in evaluating. This means that there is a wide range of information that is captured today in notational analysis depending on the environment the analyst is working in. This is in part due to the lack of a common set of performance indicators being identified as the key to sporting success, particularly in team sports where it is practically impossible to account for every single events that could lead to winning a match. A football team may consider percentage of shots on target, possession percentage and pass completion rate to be their performance indicators to benchmark themselves against for a game, while a different team in the same sport may want to consider possession percentage on the opposition's last third, defensive tackles won and total number of shots. As Hughes stated in 2011, while all these may be considered valid information to collect, the lack of a common framework across sport may be slowing down the research and analysis to develop notational analysis further.

There are certain challenges in notational analysis, particularly when it comes to live events. A single analyst notating events and patterns in real time may be subjected to human error or miss certain actions. This is why most sport statistics companies and elite sporting organisations employ several analysts to collect the same performance indicators on a live game, allowing to compare notated statistics between analysts with the purpose of improving the accuracy of the data collected. Another challenge of the notational analysis process is subjectivity, were events notated that have a certain degree of ambiguity may be captured differently by different analysts. While notational analysis aims to add objectivity when evaluating a team's performance by quantifying the events, it is possible that the definition of such events may change depending on the interpretation the analyst capturing the event has on that action.

During the last two decades, a large number of new technologies have developed the methods and effectiveness of notational analysis in sport. While traditional analyst often used a pen and a notepad to notate all the various events they considered relevant, technologies like Opta, Dartfish or Sportscode have become a central asset for notational analysts in the industry. The use of a video camera and a video analysis software can now provide analyst with a wide range of features and tools to collect as much information as they require to assess performance against specific performance indicators.


Performance Indicators in Rugby Union

In 2012, Michael T Hughes, Michal M Hughes, Jason Williams, Nic James, Goran Vuckovic and Duncan Locke wrote an insightful academic journal discussing the performance indicators in rugby union during the 2011 World Cup. They gathered various materials from professional analysts working for coaches and player at the World Cup event, and verified the reliability and accuracy of their data against video footage from different matches.

READ FULL JOURNAL HERE

rugby-655027_640.jpg

This research study analyses the influence of the following key performance indicators in the final outcome of a game:

Scoring Indicators: 

  • Points scored

    • Total points scored in WWC 2011

    • Points scored per game

    • Points scored agains Tier A teams

    • Points scored per game against Tier A teams

  • Tries scored

    • Total tries scored in WWC 2011

    • Tries scored per game

    • Tries scored from set pieces

    • Percentage of tries scored from set piece

    • Tries scored from set pieces per game

    • Tries scored from broken play

    • Percentage of tries scored from broken play

    • Tries scored from broken play per game

Quality Indicators:

  • Total Possession - Times and Productivity

    • Minutes that ball is in play in the match

    • Rest minutes in the match

    • Minutes with possession in the match

    • Percentage of time with possession

    • Number of possessions in the match

    • Minutes per possession

    • Minutes of possession per point scored

    • Number of possessions per point scored

    • Minutes of possession per try scored

    • Number of possessions per try scored

    • Total number of line breaks

    • Total number of line breaks per game

    • Minutes of possession per line break

    • Number of possessions per line break

    • Total number of set piece line breaks

    • Total number of set piece line breaks per game

    • Percentage of set piece line breaks

    • Total number of broken play line breaks

    • Total number of broken play line breaks per game

    • Percentage of broken play line breaks

    • Number of phases in the match

    • Percentage of phases per possession

    • Attacking penalties won

  • Attacking Possession

    • Number of possessions in opposition's 22 line

    • Number of converted possessions in opposition's 22 line

    • Percentage of converted possessions in opposition's 22 line

    • Number of points from opposition's 22 line

    • Number of points from opposition's 22 line per game

    • Number of points per possession in opposition's 22 line

  • Kicking game

    • Total number of kicks at goal

    • Total number of kicks converted

    • Percentage of kicks converted

    • Penalties conceded

While these key performance indicators of a rugby union game or tournament can be useful to summarize the some elements of a team's performance, what M. Hughes et al (2012) found was the there was little correlation between each individual metric, or set of metrics, with the final outcome of the World Cup 2011 tournament. For example, France was identified as one of the worst teams in most of these metrics, though they were the runners-up of the tournament.

quino-al-406222-unsplash.jpg

The paper also touches on the challenges individual player performance analysis in rugby union. Due to the nature of the sport, a specific position on the field will require its own set of performance indicators. The study suggests to analyse an individuals performance against common key performance indicators and use that individual's performance profile to run intra-position comparisons (Hughes et al, 2012). This also leads to the creation of position profiles, where strengths and weaknesses of players playing in each position can be identified. It is also suggested that the individual player profiles should be based in the context of the team's profile as well as the opposition team's strengths and weaknesses, as these elements will impact a player's performance profiling.

Similarly to most team sports, randomness and luck can play a big part in the final outcome of a rugby union match. Therefore, predicting the performance of a team based on a few data points might not be enough to correlate it to the final performance achieved by that team. There are many complex interactions that occur during a rugby union game between teammates and oppositions which are difficult to account for through today's available statistics. However, studies like the one carried out by Hughes et al (2012) are another step towards narrowing down the best procedures to follow to successfully apply analytics to rugby performance predictions and team sports in general.