Football

Interview with Alex Scanlon, Men's Performance Analyst at The FA

Alex Scanlon is a Men’s Performance Analyst at The Football Association, where he has been working with development groups since 2017. Alex joined The FA as part of the 2016 initiative to invest in winning England teams by significantly expanding the technical groups that support the various squads. Prior to that, he was a Performance Analyst for Everton’s first team before spending three and a half years working across most age groups in West Bromwich Albion’s academy. Alex tells us about his pathway to become a Performance Analyst for England.

 
Alex Scanlon The Football Association
 

Tell us about your background. What made you want to become a Performance Analyst?

I never really played football recreationally or at a higher level growing up. Only at times, but I never played at a club standard. When I went to college I did play in a national college league, but even though I played often and enjoyed it, I was never that interested in or loved playing. I was always more interested in the other side of the game; the coaching side.

I took my first coaching session when I was 14 years old, when I was still in school. My dad was a primary school teacher and I helped him out a few times at first, then started helping him out more regularly. By the time I was 16 I had my first little under 7s group of players that I would coach every week. I started doing lots of coaching and really started to enjoy the coaching side of football.

I live in Liverpool, where there are two big clubs around. The recruitment of players at that young age is quite tight. Most people from these two clubs are after the same players all the time. Somehow, we managed to get a good group of young lads in our team. Everton asked us to scout for them, gave us a kit and said “if you get any good young players, can you send them to us?”. So I started doing that as well. I managed to get into Everton’s academy and did a bit of development-centered coaching there.

I left school at the start of six form. I hated academics at that age. I wanted a to be more practical, so I left school and went to college to do a Sports Performance course. It was ok. Then off the back of that, I went to Liverpool John Moores University where I did their Science & Football course. It was only there that I started to see the opportunities in football. I got my first role holding a camera and filming games through John Moores University, filming Premier League tournaments. In my final year of the three-year course, I did a part-time internship at Everton with their first team. I was lucky to get that role and do it alongside my third year of studies.

Every year, John Moores University places an intern at Everton’s first team through their programme. I was working with Steve Brown and Paul Graley, who is still at the club. It wasn’t really working at the frontline; it was more working in the background supporting databases and doing that sort of work. It was still within the team’s environment where you could listen to the conversations and see how Steve and Paul worked and got involved on match day. I was also able to travel with the under 18s. I got to travel to a couple Youth Cup games. It was a really good experience, although I think didn’t maximise it when I reflect back on it now. I didn’t get as much out of it as I probably should have. I didn’t put enough into it as I was also trying to do the third year at the university at the same time. Maybe I wish I had asked more questions, studied the work a lot more or reflect a little more about things when I was at Everton. But it was a really good experience at the same time, I took lots from it.

After Everton, an opportunity came to work at West Bromwich Albion via the person that had done that same role at Everton two year prior. They had managed to get a job at West Brom and they knew that the pathway I had been on through John Moores University could be trusted. They knew the type of person that Everton would employed and that John Moores University educates, so they trusted that pathway. The role at West Bromwich Albion was a full-time internship. I moved down there and was living on small wage.

West Brom are really good at moving people up. You start at the bottom and work your way up very quickly. They don’t tend to replace; they try to promote from within so that when someone leaves they bump up from inside the club. For the first 5 to 6 months, I started my weeks doing the under 9s on a Monday, then under 12s on a Tuesday and he under 17s during the day if they were out of school. Eventually, the under 18s analyst moved on and I was given the opportunity to move up quite quickly. I went from doing under 9s to the under 16s programmes, to then do the under 18s and then being the under 23s analysts quite quickly. For most of the 3 and a half years I was at West Brom, I was working with the under 23s team, which is a bit like the first team these days. It was a very good experience, different to Everton as I was in the frontline delivering every game to coaches and players. Another good thing about a club like West Brom is that you end up doing a little bit of everything. You can do some first team stuff, or you can do some support work with the under 18s if they need it. It is quite a small staffed club. I ended up doing a lot of work, which was great for a first full-time job to get that kind of experience and it gave me a good skillset.

After 3 and a half years at West Brom, an England role came up. I applied to it and was successful after the second interview. England were expanding at the time. In 2016, their technical director said that as part of a new strategy everything that looked after the football side (coaching, education, team operations, performance, etc.) was expanding massively with big investments into that area. Winning England teams was a big objective, and putting the structure and the staff around those teams was part of that expansion. As part of that initiative, I applied to the role at the FA and have been there since the start of 2017. The England teams’ development staff was expanding massively. Rather than England using 5 or 6 analysts who go on the road all the time with different teams, they now have an analyst with every age group who can really get down into the detail on that age group, as well as working in other projects.

Alex Scanlon The Football Association

I am now a Men’s Performance Analyst. I work primarily with the development teams, but the role evolves all the time. The last 12 months we have barely been away with the teams. The senior team have played a lot of games, so instead we’ve done a lot of background work for them. Previously, the first 2 to 3 years I was here, we were on the road with the teams quite a lot. That was our primary focus. I’ve done camps with the under 17s, under 18s, under 19s, under 20s and I also did the under 21s European Championship. I’ve also done lots of background and support work for the seniors. That’s what the resources that we have in our department now can afford to do. Even though we try to fix an analyst with an age group to try build relationships with the coaches, if the under 19s were at a final of a tournament, any analyst that is free because, let’s say, the under 18s haven’t got a camp, those analyst would focus on supporting the under 19s at that tournament. If the under 21s are on a tournament we would put the support that way instead, behind the analysts that are on the ground with that team and support them with opposition analysis, game reviews and all of that.

That’s my pathway. I was always interested in coaching and education to develop players rather than playing. The two main parts of my pathway are the work experience from college and university experience and then the coaching side of things.

What is your main highlight in your Performance Analysis career?

My main highlight is the first 12 months that I was at England. We had an unbelievably successful 12 months with the development groups. I was lucky enough to go to 3 of the 4 tournaments that we won. That year, the under 20s won the World Cup, the under 17s won the World Cup, the under 19s won the European Championship and we had a hybrid under 20s groups also won, and I managed to go to three of them. That was definitely an unbelievable year in terms of results and emotions. Professionally for me, it was also an eye opener. I developed a lot that year. I learned how to work differently and in an international setting. It was not only successful for the teams that I worked with but my development and experiences went through the roof.

Alex Scanlon The Football Association

You may look at international football and think that it has only got 10 games a year, but that year I did 3 major tournaments, about 27 games along the road for 200 days of the year. There was so much to learn from that year. I developed a lot mainly around the analysis process. Working in a club is a different kettle of fish. You’ve got your equipment at the club and you just take what you need to the game and then it comes back to the club. Whereas with England, we went to India for 5 weeks with the under 17s and we had to take everything that we might need with us. Logistically it was a big planning operation. We also were two analysts that went out to India so we had to plan how we would work together, how we would fit in the tech groups in the squad, how we would work every day, how we would provide information to the players, how we would get the players to think about what we would want them to think about, how we would get them to talk, etc.

At a club, you get stuck in the game cycle. You are constantly preparing for the next game. Whereas for India, we were able to plan 2 to 3 months in advance and get really into the detail of what we were going to do and how we were going to work. That level of detail that we went through was a massive eye opener for me. We were very well prepared and missed no training sessions. We were so ahead of the curve in terms of preparation that the next morning after the game we could watch our game back, we could feedback and talk to the players and coaches and we could then watch the next opposition very quickly, also because we had that support coming from back home. We were able to do matchday+1, so that next time we train with the players we were preparing and learning way ahead of schedule.

At West Brom, I was delivering stuff on a Thursday afternoon for a Saturday game, which when I look at it now, I think “how did that ever work? It is too late to deliver something”. England was a big jump in level for me. At West Brom, you work day to day, game to game, but you don’t get a chance to take a step back and think “are we doing the right thing? Is this the best way of doing things? Are we maximising what we’ve got?”. Whereas with England you definitely get that opportunity to reflect. You definitely have to prepare and make sure you are on it, because you will get tested. Operationally, England was another level.

The intensity with England peaks and drops a lot more compared to a club, where it is a bit more levelled. At a club, you have a more stable level of intensity and get by and have an impact game by game, week by week. However, the intensity during a tournament with England goes through the roof because you are still expected to deliver at a high level. The intensity is mad on camp, specially the turnaround. It is so important for us to be ready for the next game having learned and reviewed the previous game. You don’t get 6 or 7 days that you would get in a club. Instead you get 2 days in between games. If you win the semi-final you’ve got to prepare the final straightaway, on top of the travel to change venues and locations. We were flying across India in our travel days and had to think about how we maximise that travel time. The intensity at international level when it peaks, it really peaks.

What are the most challenging aspects of being a Performance Analyst?

For us with England we try to change the way analysts are viewed. We want to come away from just doing the clips, the codes and the filming to really have a real impact. That is not to say that analysts don’t have an impact, of course they do. We just wanted to shape our roles to come out of that traditional view of an analyst a little. When previously there were 5 or 6 analysts constantly going around the different age groups, we now want to have a real focus and build a technical group of staff that include coaches, analysts and performance coaches to really have an impact in each group. We don’t want to just provide information to coaches, we want to challenge them and give them more informed insights. We give them better information, and if they disagree with it, it is fine. If you disagree with them, it is also fine. With England there are no hierarchical considerations when it comes to analysis.

Getting that message across the line was the main challenge for us. We were trying to change the culture around analysis while changing the way it operates. We wanted coaches to be similar to what you see in Rugby, coaches that take a lot of ownership of their content, letting them study and teach them how to produce their own clips. Educating coaches on how we work and explaining how they could take some of that work themselves became a big part of our role. Getting the coaches buy in and getting the shift towards coaches taking a lot more ownership over the analysis-type of work has been the biggest challenge of our role up to now.

What are the most important skills as a Performance Analyst?

It is important to be good with key analysis technology, to be efficient with your work and to make sure you are having an impact with the level of detail that you are offering coaches and players. A massively important skill that could often get overlooked is being a good communicator. You have to be involved in the conversation and make sure you are able to judge a room and a set of coaches. It is important that you build those relationships with coaches where you can, so that you can challenge them and comfortably say “I disagree, I think there is a better way of doing this, I think this is more important for this next game as oppose to that”. You definitely need to build your credit by being good at your job. I don’t think you can get away from that. What takes you to the next level in Performance Analysis is that impact, the communication, the clarity, the detail and making sure you can get your point across in a concise way.

How is data and analysis being used and perceived today at The FA?

At The FA, we would try to get the coaches to do a lot of the subjective analysis, where they look through clips themselves without needing an analyst. Analysts would then bring objectivity to that meeting. We would bring the objective angle by bringing the data, whether we are coding it ourselves or bringing it from a third party. We may also provide subjective opinions too when we are trusted with that, but we would primarily want to provide that objectivity. That is the piece that we are responsible for in that setting. Coaches are responsible for the technical and tactical stuff, but we would provide our input by supporting or challenging their message with data.

Data is the biggest thing that is coming in sport. There is so much of it. The most important thing for an analyst is to be a translator of data. You need to be good at the software that looks at data, writing scripts or designing outputs. It is important that you can look at data and translate it into something meaningful. We are in a place where so much data is available that the real skill is to find the good bits from it, being able to find a pattern that you can trust and that has an impact on how you work and what you do.

In terms of how data is delivered to the coaches at The FA, it is really difficult to do it on the road but it is definitely in our processes. Even though we try to incorporate our data on the road, it’s one of those situations where it is really challenging to find the right time and the right way to do it. We try to do it subtly, for example, we try do it one-on-one with the coaches or players. We never really put up charts of data on the screen. We don’t dissect information in that way as a group. If there is a point to be made about something that will support or challenge a decision, then we would make it with either data or footage.

Data has more of an impact off-camp, when we can get into the numbers, study them and build analysis to tell a story with it. You don’t really have that time when you are on the road. When we do, we look for key indicators that we can trust and compare them with the metrics that we normally use and benchmark with. We have some Tableau outputs that we use to visualise data. We are able to use tools like that, but the challenge is finding the right time. You also don’t want to be a person that produces a graph and that’s it. You want to have an impact by providing more meat on the bone. We have way more impact with data when we are off-camp and we can do projects, study and do really good comparisons. However, we do have the tools to be able to use it on-camp if we want to have a very quick look on specific stats. That is the way we use it when on-camp.

In general, we tend to use more video than data. This is probably because it follows the flow of how we give feedback to players and what we show them. We are normally going to be showing them some video examples and talk about the game rather than get into the mud with the data with them. Having said that, data tools are there for us to use as analysts, and the coaches do listen to the data. They are receptive to it if they can see the value and is communicated well and it is translated into their language. That is why translation and communication is massive as an analyst. 

What are the main tools and technologies you use in you analysis?

At The FA we utilise Hudl. We use SportsCode and Hudl’s online platform to house and share video with players and coaches. We also have Hudl Replay for live video in the game. We utilise Hudl packages quite a lot. All the coaches have SportsCode licenses on their laptops as well as the analysts. We try to include SportsCode into coaching education courses and give coaches some licenses so that they can get on their laptops and use it as part of their development. We also use CoachPaint if we want to do illustrations, since it has various ways of doing them. We also collaborate online by sharing documents and game plans. We used to use Google to share documents online but have now moved on to Microsoft. We also use Tableau to manipulate and present data.

In terms of footage, as much as we can we try film ourselves so that we know we can trust our own footage. The level of support in international football is quite mixed. You have some teams that don’t have an analyst at all and just have someone filming the game for them for the day and that’s it. Then there are other nations that are similar to us and are heavily resourced. So as much as we can we try film ourselves. Although, UEFA do a really good job at trying to provide footage for the tournaments, same as FIFA, but it is not always reliable and you are not always playing in a UEFA or FIFA competition either. In the cases where we can’t film a game, we’ve got good relationships with some nations who we exchange footage with. We are really open to sharing because we’ve got nothing to hide in terms of footage. The good thing is that we get a wide angle from most of our opposition teams.

What does the future of Performance Analysis look like?

Data is the next big thing in Performance Analysis. There is lots of it at the minute but we only use a fraction of it. There are lots of companies and third parties that are doing very cool stuff. Some organisations code in-house like we do. The skills needed will be people who can refine it, study it and pick out useful information from it, as opposed to just collecting it and looking at it.

Finding useful information from the data is key. If you are not skilled at Python or R, there is still a place in the translation of the data and the presentation and delivery of it to coaches and players. The role of an analyst will need to evolve that way because a lot more coaches, especially the younger coaches that are coming through now and managers at the top level are all proficient on their laptops. Coaches don’t need an analyst just for the clips because they now can do that themselves. Analysts need to add value in a different way and data analysis is where I see it going towards.

What advice would you give to someone looking to get into Performance Analysis?

There are so many ways to get into Performance Analysis. There is not just one way of doing it and I don’t think there is a secret to it either. As much as you can, get out there. If you are at university, just offer yourself. You might have to do work free of charge just to get that experience at first. A lot of people have done that and will carry on doing that. It is how you make yourself stand out as a candidate for when you do look for your next job and get the opportunity.

There is nothing stopping you from watching football on TV and doing tactical reports. There is also nothing stopping you from getting hold of data, there is so much free data that is out there if you’ve got the skills to use it. Nothing stop you from getting hold of that data and doing some work with it. There are enough platforms to get data out there and there is a big community online, like Twitter. You’ve got to put your work out there and when the opportunity comes, take it and don’t look back.

The one thing that I’d take from my career so far is when I was very split of whether I moved down to Birmingham and work for West Brom or not. The money wasn’t great to live on but it was a good internship. I ended up doing it and that decision paid off in terms of the pathway that then followed because of that. You don’t get many opportunities so if you get one, take it.

A New Way Of Classifying Team Formations In Football

One of the most important tactical decisions made in football is deciding on the best team formation,  determining what roles each player has and the playing style. Laurie Shaw and Mark Glickman from the Department of Statistics at Harvard University recently developed an innovative, data-driven way of identifying different tendencies seen by managers when giving tactical instructions to their players, specifically around team formations. They measured and classified 3,976 observations of different spatial configurations of players on the pitch for teams with and without the ball. They then analysed the changes of these formations throughout the course of a match.

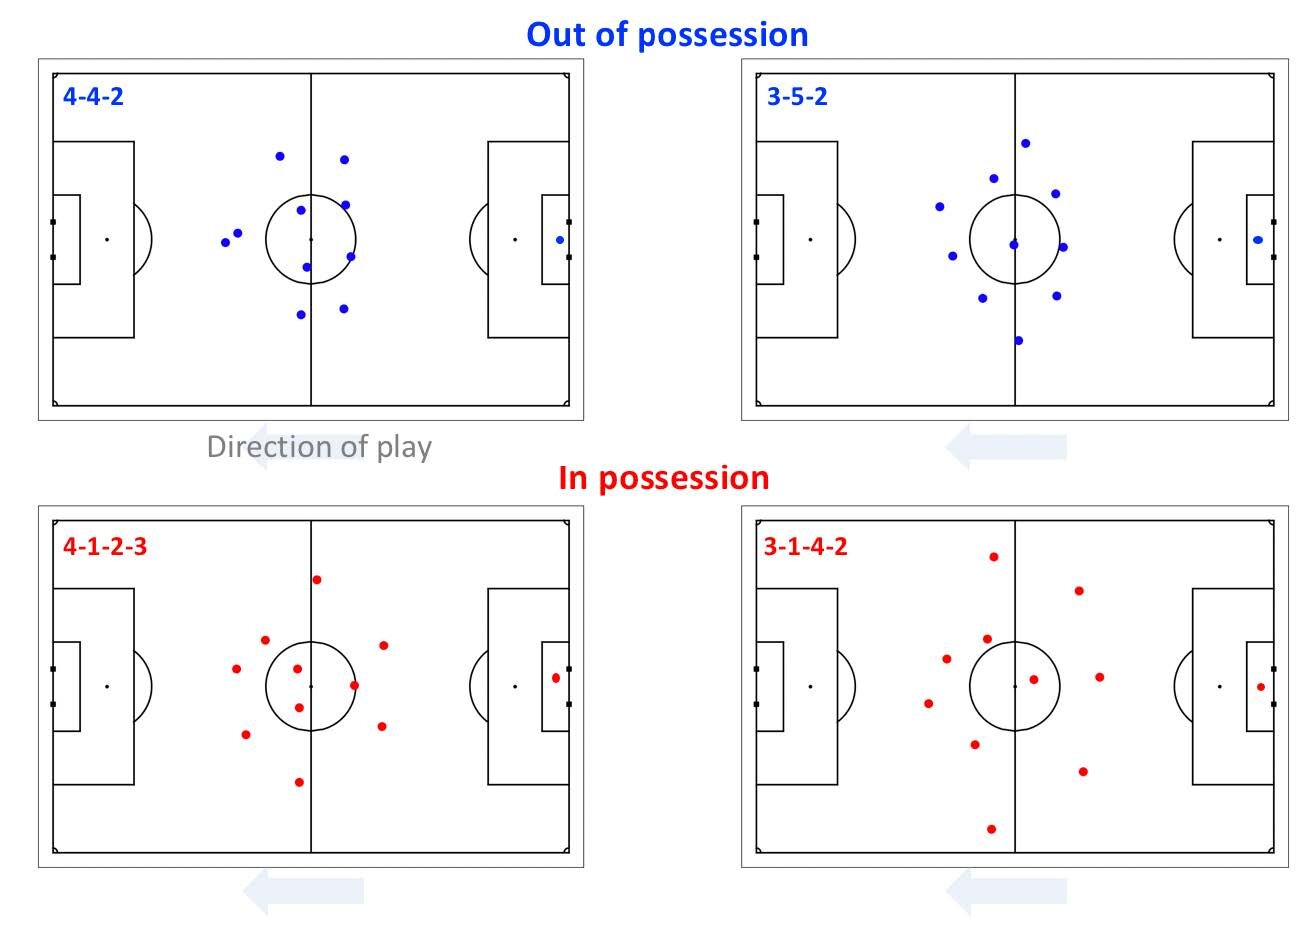
 While team formations in football have evolved over the years, they continue to heavily rely on a classification system that simply counts the number of defenders, midfielders and forwards (i.e. 4-3-3). However, Laurie and Mark argued that this system only provides a crude summary of player configurations within a team, ignoring the fluidity and nuances these formations may experience during specific circumstances of a match. For instance, when Jürgen Klopp prepares his formations at Liverpool, he creates a defensive version where all players know their roles and an offensive one that aims to exploit the best areas of the pitch. Therefore, Liverpool prepare different formations for different phases of the game; a detail that is lost when describing them as using a simple 4-3-3 formation.

Identifying Defensive And Offensive Formations

The researchers used tracking data to make multiple observations of team formations in the 100 matches analysed; separating formations with and without possession. By doing so, they identified a unique set of formations that are most frequently used by teams. These groups helped them classify new formation observations to then analyse major tactical transitions during the course of a match.

Source: Shaw, L. & Glickman, M. (2019) Dynamic analysis of team strategy in professional football. Barça Sports Analytics Summit.

Source: Shaw, L. & Glickman, M. (2019) Dynamic analysis of team strategy in professional football. Barça Sports Analytics Summit.

The above diagram from Laurie and Mark’s study shows a defending team moving as a coherent block by having players retain their relative position, showing that their formation is not defined by the positions of players on the pitch in absolute terms but by their positions relative to one another. Starting from the player in the densest part of the team, Laurie and Mark calculated the relative position of each player using the average angle and distance between said player and his nearest neighbour over a specific time period in a match, and subsequently repeating the same process with the latter’s neighbor and so on. By calculating the average vectors between all pairs of players in the team, they obtained a center of mass of a team’s formation, which is then aligned to the centre of the pitch when plotting team formations.

Source: Shaw, L. & Glickman, M. (2019) Dynamic analysis of team strategy in professional football. Barça Sports Analytics Summit.

Source: Shaw, L. & Glickman, M. (2019) Dynamic analysis of team strategy in professional football. Barça Sports Analytics Summit.

The researchers made multiple observations of a team’s defensive and offensive configurations throughout the match. They aggregated together the observed possession into two-minute intervals. For example, for the team in possession they plotted all possessions into two-minutes time periods and then measured their formations in each of those sets, and did the same process for the team without possession during the same time period.

The diagram below shows a set of formation observations for a team during a single match, illustrating that the team defends with a 4-1-4-1 formation, but attacks with three forwards and with the fullbacks aligning with the defensive midfielder. These findings also illustrate that while the defensive players remained compacted, the movement of attacking players, such as central striker was more varied. The consistency in all the observations also suggest that the managers did not change formations significantly during the match. 

Source: Shaw, L. & Glickman, M. (2019) Dynamic analysis of team strategy in professional football. Barça Sports Analytics Summit.

Source: Shaw, L. & Glickman, M. (2019) Dynamic analysis of team strategy in professional football. Barça Sports Analytics Summit.

Grouping Similar Formations Together Into Five Clusters

Additionally, Laurie and Mark used an agglomerative hierarchical clustering to identify unique sets of formations that teams used in the 100 matches analysed; constituting 1,988 observations of defensive formations and 1,988 observations of offensive ones. To be able to group formations together, they first had to define a metric that established the level of similarity between two separate formations. The similarity between two players in two different formations is quantified using the Wasserstein distance, using their two bivariate normal distributions, with their own means and covariance matrix, where the Wassertein distance between them is calculated by squaring the L2 norm of the difference between their means. However, an entire team’s formation consists on a set of 10 bivariate normal distributions, one for each outfield player. Therefore, to compare two different team formations the researchers calculated the minimum cost of moving from one distribution to another using the total Wasserstein distance. The blue area in the diagram below indicates the number of players that deviate from the formation’s average position.

Laurie and Mark also found that two formations may be identical in shape, but one may be more compact than the other. In order to classify formations solely by shape and not by their degree of expansion across the pitch, they had to scale the formations so that compactness is no longer a discriminator in their clustering.

Once this was resolved, the hierarchical clustering applied to the dataset simply found two most similar formation observations based on the Wasserstein distance metric to combine them and form a group. Then, it found the next two most similar ones, forming more groups, and so on. This process identified 5 groups of formations with each group containing 4 variant formations, producing a total of 20 unique formations.

Source: Shaw, L. & Glickman, M. (2019) Dynamic analysis of team strategy in professional football. Barça Sports Analytics Summit.

Source: Shaw, L. & Glickman, M. (2019) Dynamic analysis of team strategy in professional football. Barça Sports Analytics Summit.

 The first group of formations correspond to 17% of all observations in the sample of Laurie and Mark’s study. The commonality of these four variants in the first group of formations is that there are five defenders, but with variations in the number of midfielders and forwards. This group of formations was most predominant in defensive situations, with between 73%-88% of their observations being of teams without possession.

Sports Performance Analysis - Team Formations
Source: Shaw, L. & Glickman, M. (2019) Dynamic analysis of team strategy in professional football. Barça Sports Analytics Summit.

Source: Shaw, L. & Glickman, M. (2019) Dynamic analysis of team strategy in professional football. Barça Sports Analytics Summit.

Group 2 and Group 3 share the commonality of having 4 defenders, with group two in the second row consisting of more compact midfields, as oppose to a more expanded midfield in Group 3 formations.

Source: Shaw, L. & Glickman, M. (2019) Dynamic analysis of team strategy in professional football. Barça Sports Analytics Summit.

Source: Shaw, L. & Glickman, M. (2019) Dynamic analysis of team strategy in professional football. Barça Sports Analytics Summit.

Group 4 contained predominantly attacking formations consisting on three defenders, where the wingbacks push high up the pitch, and with variations in structure of the midfield and forward line.

Source: Shaw, L. & Glickman, M. (2019) Dynamic analysis of team strategy in professional football. Barça Sports Analytics Summit.

Source: Shaw, L. & Glickman, M. (2019) Dynamic analysis of team strategy in professional football. Barça Sports Analytics Summit.

Group 5 formations contained two defenders with fullbacks pushed up the field and with some variations in the forward line with either two or three forwards, as well as different structures on the midfield. These group of formations consistent entirely in offensive formations observations.

As illustrated by these groupings, the hierarchical clustering Laurie and Mark applied was very efficient in separating offensive and defensive formation observations, even after excluding the dimension of the area of the formation (i.e. how compact the formations are) as a discriminator. Additionally, while some of these formations aligned with traditional ways to describe formations, such as 4-4-2 or 4-1-4-1, others do not clearly fall within these historical classifications. Once the formation clusters were identified, the researchers developed a basic model selection algorithm to categorise any new formation observations into any of these groups by finding the maximum likelihood cluster.

Transitions Between Offensive And Defensive Formations

Laurie and Mark took their research a step forward by evaluating the pairing tendencies by coaches of the various defensive and offensive formations. In the diagram below, they illustrated that the teams that defend with Cluster 2 frequently transition into an offensive formation like the one in Cluster 16, with the wingbacks pushing up. Also, half of the teams with the defensive formation in Cluster 9 tend to use the offensive formation in Cluster 10, while the other half transition to a formation similar to Cluster 18. This demonstrated a clear story in to how a player transitions from their defensive role to their attacking role. Moreover, it showed that some defensive formations allow more variety in terms of the offensive formations than others.

Source: Shaw, L. & Glickman, M. (2019) Dynamic analysis of team strategy in professional football. Barça Sports Analytics Summit.

Source: Shaw, L. & Glickman, M. (2019) Dynamic analysis of team strategy in professional football. Barça Sports Analytics Summit.

Tactical Match Analysis Through This Methodology

The methodology developed by Laurie and Mark allows teams to measure and detect significant changes in formations throughout the match. They were able to produce diagrams such as the one below to illustrate the formation changes in both defensive (diamonds) and offensive (circles), including annotations of goals (top lines) and substitutions (bottom lines). The story of the match in the diagram shows a red team conceding a goal in the first half and then making a significant tactical change at half time as well as a substitution. Laurie and Mark found this situation very usual, as whenever there was a major tactical change it was often accompany with a substitution. Comparing with other matches, they found that this particular red team made major tactical changes at half time in around a quarter of their matches, providing insights into how their manager reacts to given situations.

Source: Shaw, L. & Glickman, M. (2019) Dynamic analysis of team strategy in professional football. Barça Sports Analytics Summit.

Source: Shaw, L. & Glickman, M. (2019) Dynamic analysis of team strategy in professional football. Barça Sports Analytics Summit.

In another diagram, they demonstrated how their methodology can also help study how changes in formation begin impact the outcome of a match. In this match, the blue team were predominantly attacking down the wings in the first half, with most of their high quality opportunities coming from right wing. In the second half, the red team changed their formation to five defenders instead of four, which reduced the attacks from the blue team’s right wing and instead going through the centre, presumably less busy since they now have two midfielders rather than three.

Source: Shaw, L. & Glickman, M. (2019) Dynamic analysis of team strategy in professional football. Barça Sports Analytics Summit.

Source: Shaw, L. & Glickman, M. (2019) Dynamic analysis of team strategy in professional football. Barça Sports Analytics Summit.

Finally, this methodology also allows teams to establish the link between chance creation and formation structure. They can also measure how different the position of opposing players is from their preferred defensive structure (i.e. how are are they out of position). At the same time, it allows for the measurement of the level of attacking threat by assessing the amount of high value territory the attacking team controls near the defending team’s goal. These pitch control models enable the measurement of threatening positions even when no shot took place. Laurie and Mark suggest that this kind of analysis allows teams to better understand how the attacking team maneuvers defenders out of their positions or how they take advantage defending team being out of position after a high press or a counterattack.

Citations:

  • Shaw, L. & Glickman, M. (2019) Dynamic analysis of team strategy in professional football. Barça Sports Analytics Summit. Link to paper

Automated Tracking Of Body Positioning Using Match Footage

A team of imaging processing experts from the Universitat Pompeu Fabra in Barcelona have recently developed a technique that identifies a player’s body orientation on the field within a time series simply by using video feeds of a match of football. Adrià Arbués-Sangüesa, Gloria Haro, Coloma Ballester and Adrián Martín (2019) leveraged computer vision and deep learning techniques to develop three vector probabilities that, when combined, estimated the orientation of a player’s upper-torso using his shoulder and hips positioning, field view and ball position.

This group of researchers argue that due to the evolution of football orientation has become increasingly important to adapt to the increasing pace of the game. Previously, players often benefited from sufficient time on the ball to control, look up and pass. Now, a player needs to orientate their body prior to controlling the ball in order to reduce the time it takes him to perform the next pass. Adrià and his team defined orientation as the direction in which the upper body is facing, derived by the area edging from the two shoulders and the two hips. Due to their dynamic and independent movement, legs, arms and face were excluded from this definition.  

Sports Performance Analysis - OpenPose

To produce this orientation estimate, they first calculated different estimates of orientation based on three different factors: pose orientation (using OpenPose and super-resolution for image enhancing), field orientation (the field view of a player relative to their position on the field) and ball position (effect of ball position on orientation of a player). These three estimates were combined together by applying different weightings and produce the final overall body orientation of a player.

1. Body Orientation Calculated From Pose

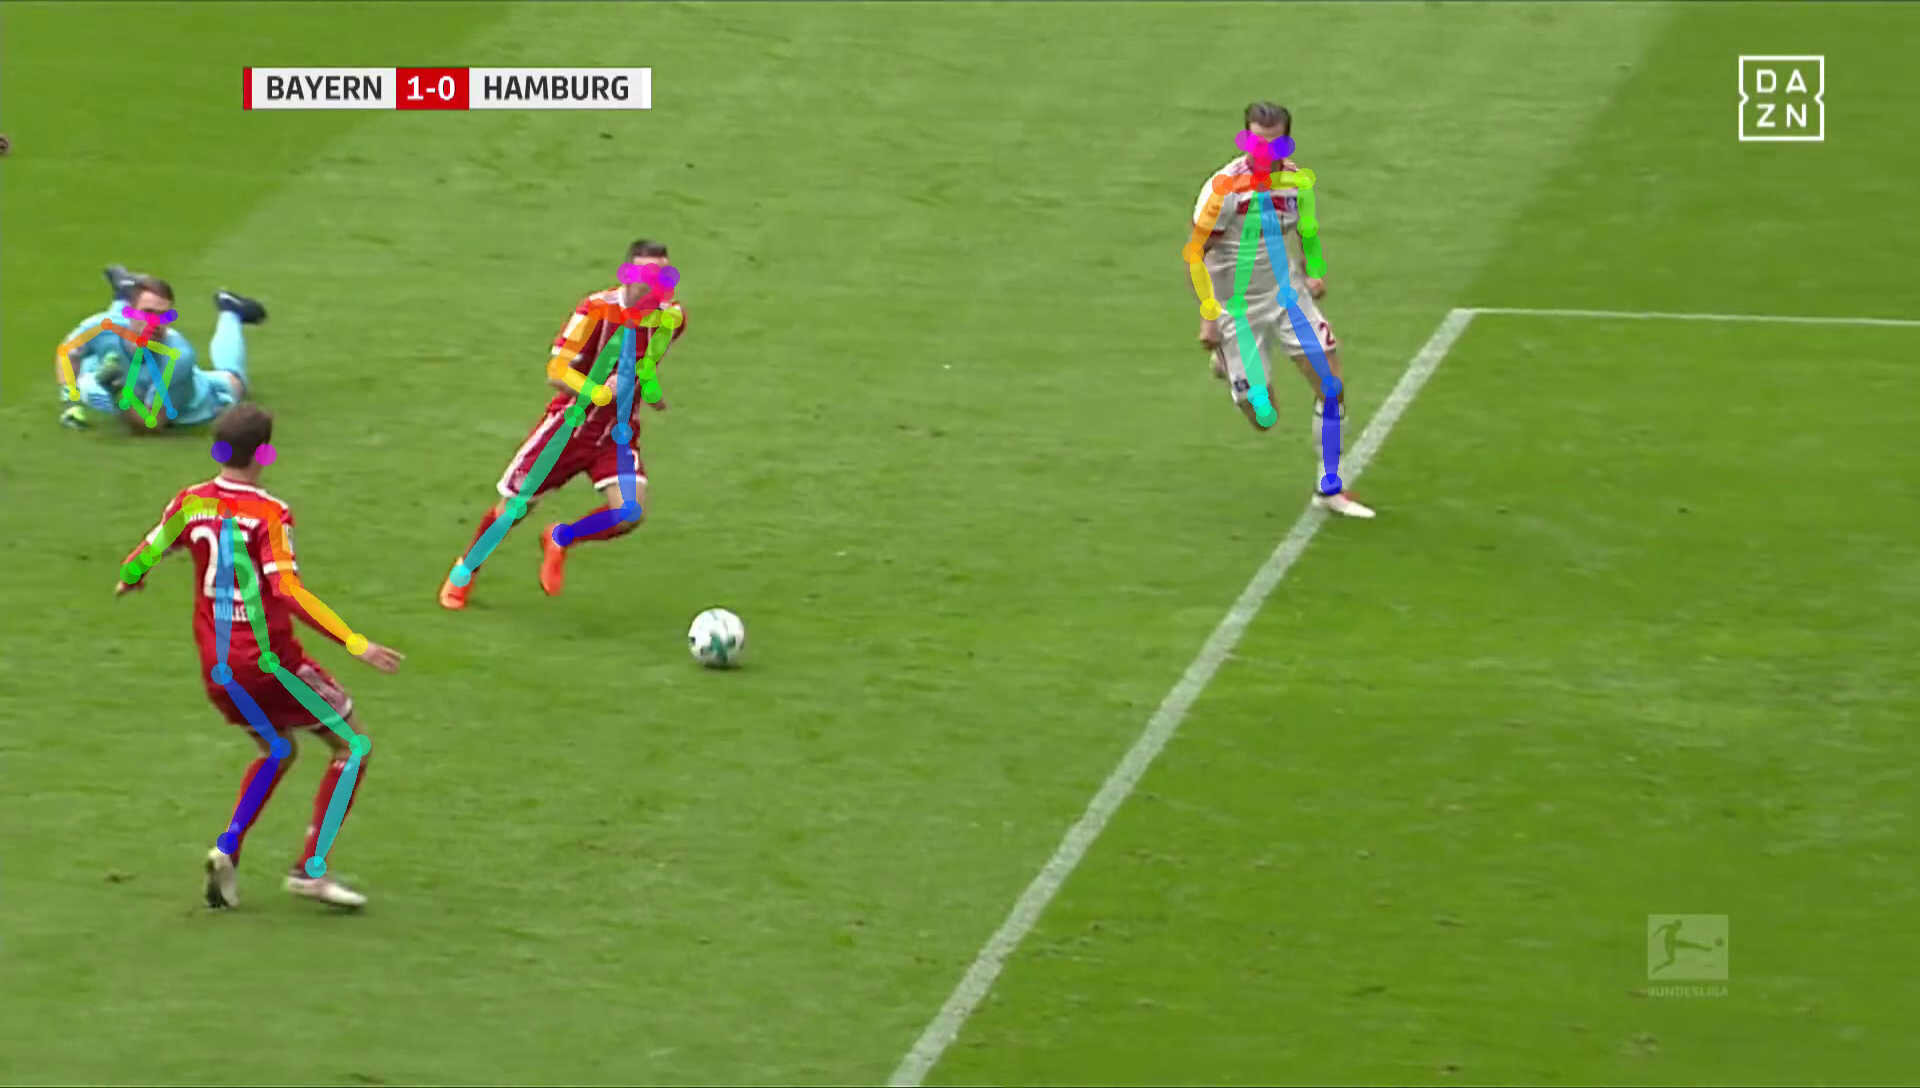
The researchers used the open source library of OpenPose. This library allows you to input a frame and retrieve a human skeleton drawn over an image of a person within that frame. It can detect up to 25 body parts per person, such as elbows, shoulders and knees, and specify the level of confidence in identifying such parts. It can also provide additional data points such as heat maps and directions.

However, unlike in a closeup video of a person, in sports events like a match of football players can appear in very small portions of the frame, even in full HD frames like broadcasting frames. Adrià and team solved this issue by upscaling the image through super-resolution, an algorithmic method to image resolution by extracting details from similar images in a sequence to reconstruct other frames. In their case, the researcher team applied a Residual Dense Network model to improve the image quality of faraway players. This deep learning image enhancement technique helped researchers preserve some image quality and detect the player’s faces through OpenPose thanks to the clearer images. They were then able to detect additional points of the player’s body and accurately define the upper-torso position using the points of the shoulders and hips.

Source: Arbues-Sangüesa, A.; Haro, G.; Ballester C. & Martin A. (2019) Head, Shoulders, Hip and Ball... Hip and Ball! Using Pose Data to Leverage Football Player Orientation. Barça Sports Analytics Summit.

Source: Arbues-Sangüesa, A.; Haro, G.; Ballester C. & Martin A. (2019) Head, Shoulders, Hip and Ball... Hip and Ball! Using Pose Data to Leverage Football Player Orientation. Barça Sports Analytics Summit.

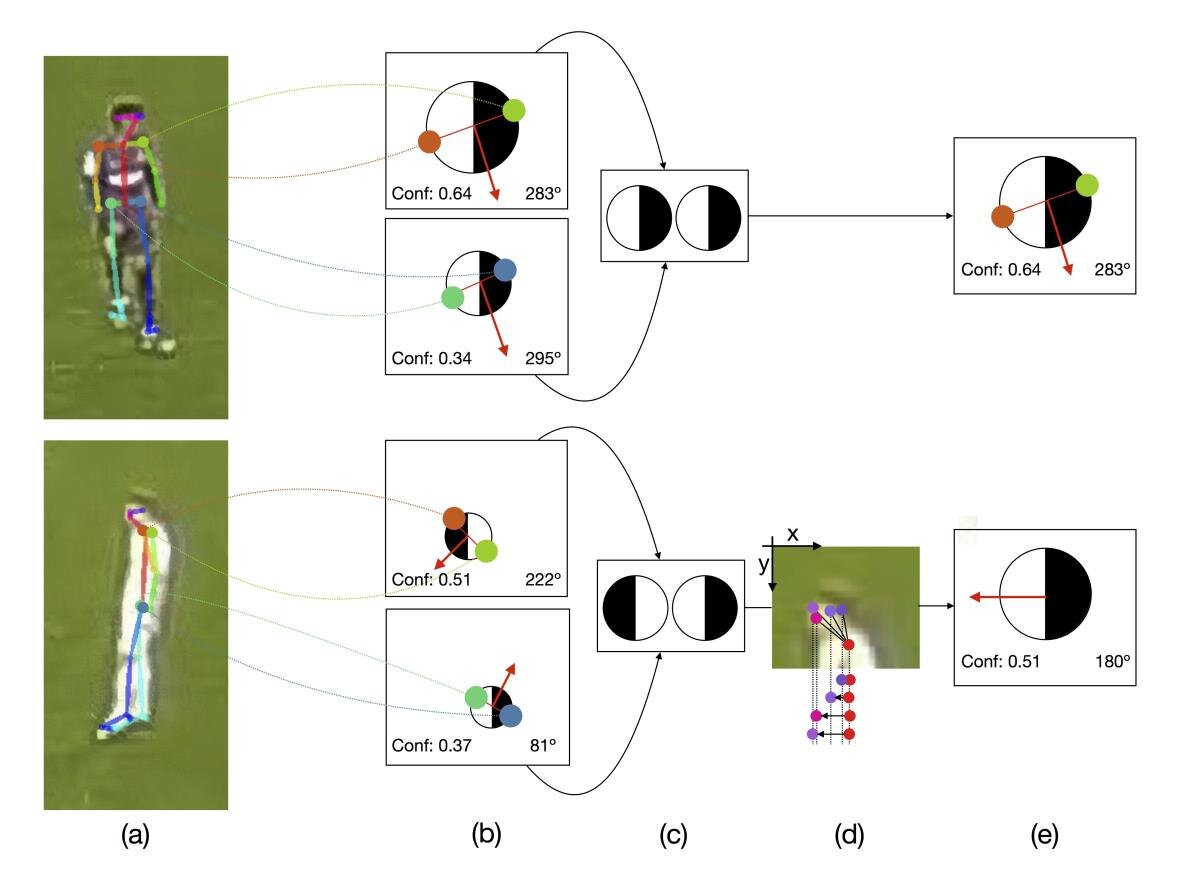
Once the issue with image quality was solved by researchers and the player’s pose data was then extracted through OpenPose, the orientation in which a player was facing was derived by using the angle of the vector extracted from the centre point of the upper-torse (shoulders and hips area). OpenPose provided the coordinates of both shoulders and both hips, indicating the position of these specific points in a player’s body relative to each other. From these 2D vectors, researchers could determine whether a player was facing right or left using the x and y axis of the shoulder and hips coordinates. For example, if the angle of the shoulders shown in OpenPose is 283 degrees with a confidence of 0.64, while the angle of the hips is 295 degrees with a confidence level of 0.34, researchers will use the shoulders’ angle to estimate the orientation of the player due to its higher confidence level. In cases where a player is standing parallel to the camera and the angles of either the hips or the shoulders are impossible to establish as they are all within the same coordinate in the frame, then researchers used the facial features (nose, eyes and ears) as a reference to a player’s orientation, using the neck as the x axis.

Source: Arbues-Sangüesa, A.; Haro, G.; Ballester C. & Martin A. (2019) Head, Shoulders, Hip and Ball... Hip and Ball! Using Pose Data to Leverage Football Player Orientation. Barça Sports Analytics Summit.

Source: Arbues-Sangüesa, A.; Haro, G.; Ballester C. & Martin A. (2019) Head, Shoulders, Hip and Ball... Hip and Ball! Using Pose Data to Leverage Football Player Orientation. Barça Sports Analytics Summit.

This player and ball 2D information was then projected into the football pitch footage showing players from the top to see their direction. Using the four corners of the pitch, researchers could reconstruct a 2D pitch positioning that allowed them to match pixels from the footage of the match to the coordinates derived from OpenPose. Therefore, they were now able to clearly observe whether a player in the footage was going left or right as derived by their model’s pose results.

Source: Arbues-Sangüesa, A.; Haro, G.; Ballester C. & Martin A. (2019) Head, Shoulders, Hip and Ball... Hip and Ball! Using Pose Data to Leverage Football Player Orientation. Barça Sports Analytics Summit.

Source: Arbues-Sangüesa, A.; Haro, G.; Ballester C. & Martin A. (2019) Head, Shoulders, Hip and Ball... Hip and Ball! Using Pose Data to Leverage Football Player Orientation. Barça Sports Analytics Summit.

In order to achieve the right level of accuracy in exchange for precision, researchers clustered similar angles to create a total of 24 different orientation groups (i.e. 0-15 degree, 15-30 degrees and so on), as there was not much difference in having a player face an angle of 0 degrees or 5 degrees.

 2. Body Orientation Calculated From Field View Of A Player

Researchers then quantified field orientation of a player by setting the player’s field of view during a match to around 225 degrees. This value was only used as a backup value in case of everything else fails, since it was a least effective method to derive orientation as the one previously described. The player’s field of view was transformed into probability vectors with values similar to the ones with pose orientation that are based on y coordinates. For example, a right back on the side of the pitch will have its field of view reduced to about 90 degrees, as he is very unlikely to be looking outside of the pitch.

Source: Arbues-Sangüesa, A.; Haro, G.; Ballester C. & Martin A. (2019) Head, Shoulders, Hip and Ball... Hip and Ball! Using Pose Data to Leverage Football Player Orientation. Barça Sports Analytics Summit.

Source: Arbues-Sangüesa, A.; Haro, G.; Ballester C. & Martin A. (2019) Head, Shoulders, Hip and Ball... Hip and Ball! Using Pose Data to Leverage Football Player Orientation. Barça Sports Analytics Summit.

3. Orientation Calculated From Ball Positioning

The third estimation of player orientation was related to the position of the ball on the pitch. This assumed that players are affected by their relative position in relation to the ball, where players closer to the ball are more strongly oriented towards it while the orientation of players further away from it may be less impacted by the ball position. This step of player orientation based on ball position accounts for the relative effect of ball position. Each player is not only allocated a particular angle in relation to the ball but also a specific distance to it, which is converted into probability vectors.

Source: Arbues-Sangüesa, A.; Haro, G.; Ballester C. & Martin A. (2019) Head, Shoulders, Hip and Ball... Hip and Ball! Using Pose Data to Leverage Football Player Orientation. Barça Sports Analytics Summit.

Source: Arbues-Sangüesa, A.; Haro, G.; Ballester C. & Martin A. (2019) Head, Shoulders, Hip and Ball... Hip and Ball! Using Pose Data to Leverage Football Player Orientation. Barça Sports Analytics Summit.

Combination Of All The Three Estimates Into A Single Vector

Adrià and the research team contextualized these results by combining all three estimates into as single vector by applying different weights to each metric. For instance, they found that field of view corresponded to a very small proportion of the orientation probability than the other two metrics. The sum of all the weighted multiplications and vectors from the three estimates will correspond to the final player orientation, the final angle of the player. By following the same process for each player and drawing their orientation onto the image of the field, player movements can be tracked during the duration of the match while the remain on frame.

In terms of the accuracy of the method, this method managed to detect at least 89% of all required body parts for players through OpenPose, with the left and right orientation rate achieving a 92% accuracy rate when compared with sensor data. The initial weighting of the overall orientation became 0.5 for pose, 0.15 for field of view and <0.5 for ball position, suggesting the pose data is the highest predictor of body orientation. Also, field of view was the least accurate one with an average error of 59 degrees and could be excluded altogether. Ball orientation performs well in estimating orientation but pose orientation is a stronger predictor in relation to the degree of error. However, the combination of all three outperforms the individual estimates.

Some limitations the researchers found in their approach is the varying camera angles and video quality available by club or even within teams of the same club. For example, matches from youth teams had poor quality footage and camera angles making it impossible for OpenPose to detect players at certain times, even when on screen.  

Source: Arbues-Sangüesa, A.; Haro, G.; Ballester C. &amp; Martin A. (2019) Head, Shoulders, Hip and Ball... Hip and Ball! Using Pose Data to Leverage Football Player Orientation. Barça Sports Analytics Summit.

Source: Arbues-Sangüesa, A.; Haro, G.; Ballester C. & Martin A. (2019) Head, Shoulders, Hip and Ball... Hip and Ball! Using Pose Data to Leverage Football Player Orientation. Barça Sports Analytics Summit.

Finally, Adrià et al. suggest that video analysts could greatly benefir from this automated orientation detection capability when analyzing match footage by having directional arrows printed on the frame that facilitate the identification of cases where orientation can be critical to develop a player or a particular play. The highly visual aspect of the solution makes is very easily understood by players when presenting them with information about their body positioning during match play, for both first team and the development of youth players. This metric could also be incorporated into the calculation of the conditional probability of scoring a goal in various game situations, such as its inclusion during modeling of Expected Goals. Ultimately, these innovative advances in automatic data collection can relief many Performance Analyst from hours of manual coding of footage when tracking match events.

Citations:

Arbues-Sangüesa, A.; Haro, G.; Ballester C. & Martin A. (2019) Head, Shoulders, Hip and Ball... Hip and Ball! Using Pose Data to Leverage Football Player Orientation. Barça Sports Analytics Summit. Link to article.

Scout7, a bespoke software for scouting

Scout7 is one of the platforms offered by Opta to help decision making in the global recruitment and development of players. It offers clubs performance data on over 520,000 players across the world and the ability to watch over 3 million minutes of video footage on their performances. The advantage of Scout7 over similar platforms is that it is usually integrated in a bespoke manner into the club's systems, allowing it to be tailored differently for each club according to that club's needs.

More than just an extensive player database, Scout7 allows clubs across the general management of their data by providing them with clear organisation and access to their information and support various departments' needs. Under the umbrella brand Intelligent Sports Framework, the Scout7 platform offers three different services to not only help with scouting but also improve the video databases for the clubs as well as provide tools for training and player development. The iSF platform is constituted of ProScout7, Scout7.tv and TrainingGround, each offering a different set of features to complement the overall software. iSF enables a scouting team to create their own custom report templates and live data widgets so that the information most frequently needed can be accessed almost immediately.

Scout7 captures their own data from matches and players across the world that can be easily accessed by scouts through Scout7.tv, where Scout7 uploads all their high definition footage. Scout7.tv also offers many advanced filtering options to find specific players or game, analyse game statistics and also create your own clips of interesting players. On top of that, the data can be augmented with other compatible third party integrations if the club needs to do so, converting it in an even more complete platform for scouting. 

It is with ProScout7, another piece of Scout7's overall platform, where all the scouting information and actions take place. ProScout7 is a management system for scouting reports and assessment of players, where information can be flagged and shared to the rest of the scouting department for further analysis or decision making. In this section, scouts can create recommendation lists of players they wish to flag and rate each of the players the club wishes to pursue. These lists and player ratings can also be archived for later use. Similarly to Scout7.tv, scouts can also use advanced search functionality to find players of certain criteria and characteristics they are looking for, and compliment their assessments with reports from the Scout7 team themselves to consolidate a more complete view on particular players.

Lastly, the TrainingGround platform from Scout7 aims to take a more internal look at the club's current players and support coaches with development and injury prevention. From basic functionally such as planning training drills and reporting on performance of the team's matches to capturing physiological data of each player to run comparisons and deeper analysis as well as keeping a health record of injuries and treatments. While TrainingGround offers a simpler set of tools than ProScout7 and Scout7.tv, it demonstrates the attempt Scout7 is making to become the sole platforms for day-to-day club management in all areas and departments. Thanks to their close collaboration with the clubs due to its tailor-made integration of Scout7, they can find technological gaps in other areas of the club, get valuable feedback directly from the team and go back and build solutions that fit exactly those needs.

LEARN MORE ABOUT SCOUT7

Performance Indicators in Football

Micheal Hughes et al discussed in 2012 in their article "Moneyball and soccer - an analysis of the key performance indicators of elite male soccer players by position", how team sports like football offer an ideal scope for analysis thanks to the numerous factors and combinations, from individual to teams, that can be used to identify performance influencers.

READ HUGHES M.D. ET AL'S FULL ARTICLE HERE

The article suggests that, in a sport like football, in order for a team to be successful, each player must effectively undertake a specific role and a set of functions based on the position the play in on the field. Through a study carried out with 12 experts and 51 sport science students, they aimed to identify which are the most common performance indicators that should be evaluated in a player's performance based on their playing profile. They started by defining the following playing positions in football:

  • Goalkeeper

  • Full Back

  • Centre Back

  • Holding Midfilder

  • Attacking Midfilder

  • Wide Midfielder

  • Strikers

Each performance indicator identified by position would be then categorized into the following 5 categories:

  • Physiological

  • Tactical

  • Technical - Defensive

  • Technical - Attacking

  • Psychological

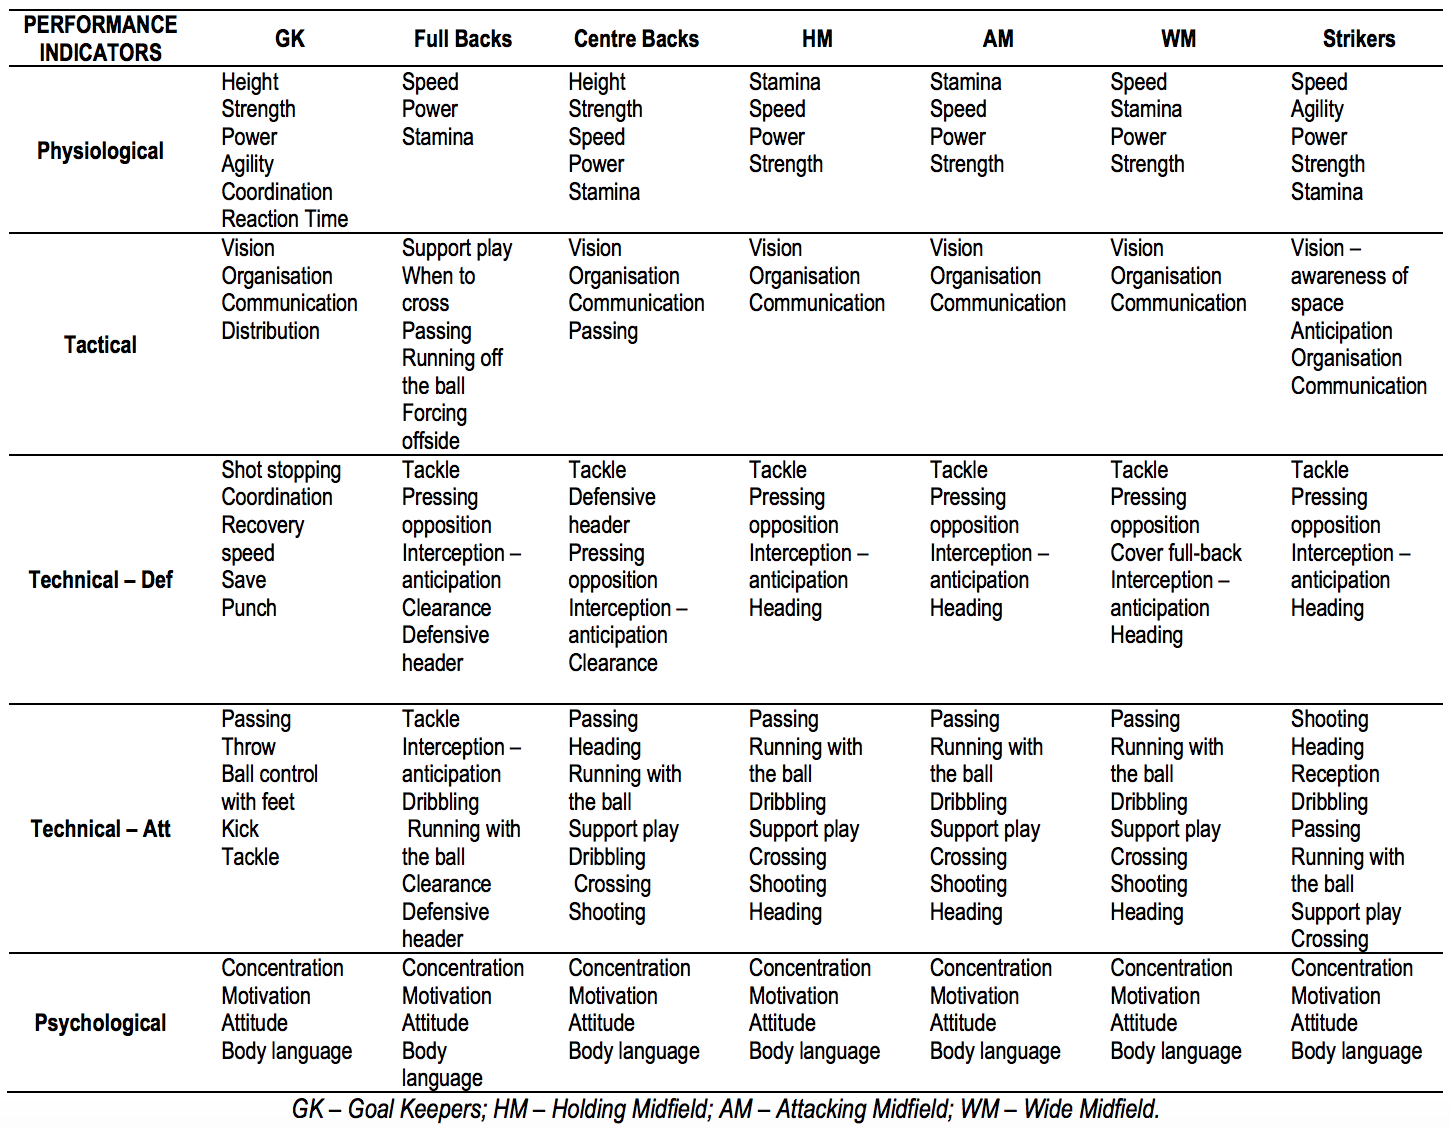
Through group discussions between the experts and the level 3 sport scientist, they came up with the following traits required for each of the above positions.

Source: Moneyball and soccer by Michael Hughes et al (2012)

Source: Moneyball and soccer by Michael Hughes et al (2012)

The study identified that most performance indicators of outfield players were the same across position, with only the order of priority of each PI varying by position. Only goalkeepers had a different set of PIs than any other position. While these classifications of skills by position were done in a subjective method (ie. group discussion), it is a good first step towards the creation of techno-tactical profiles based on the players position and functions on the field, as pointed out by Dufour in 1993 in his book 'Computer-assisted scouting in soccer'. The above table provides a framework in which coaches and analyst can further evaluate the performance of players in relation to their position. However, tactics and coaching styles or preferences may cause the order of priority of each PI within each category to vary by team. The article also suggests that a qualitative way of measuring the level of each performance indicator should be used to evaluate a particular player.

The above suggests that positions may play a key role when assessing performance in footbal. From a quantitative perspective, when analysing the performance indicators to determine success or failure, or even to establish a benchmark to which to aim for, there are several metrics an analyst will look to gather through notational analysis:

Technical:

  • Shooting game

    • Total number of goals

    • Total number of shots

    • Total number of shots on target

    • Total shot to goal scoring rate (%)

    • Total shot on target to goal scoring rate (%)

    • Shots to goal ratio

    • Shots on target to goal ratio

    • Total number of shots by shooting position (ie. inside the box)

    • Total number of shots by shot type (ie. header, set piece, right foot, etc.)

    • xG (read more)

  • Passing game

    • Total number of passes

    • Total pass completion rate (%)

    • Total number of short passes (under X metres away)

    • Total short pass completion rate (%)

    • Total number of long passes (over X metres away)

    • Total long pass completion rate (%)

    • Total number of passes above the ground

    • Total chip/cross pass completion rate (%)

    • Total number of passes into a particular zone (ie. 6 yard box)

    • Total zone pass completion rate (%)

    • Pass to Goal ratio

    • Total number of unsuccessful passes leading to turnovers (ie. interceptions)

    • Total pass turnover rate (%)

  • Defensive game

    • Total number tackles

    • Total number of tackles won

    • Total tackle success rate (%)

    • Total number of tackles in the defensive third zone

    • Total number of tackles won in the defensive third zone

    • Total number of fouls conceded

    • Total number of fouls conceded leading to goals conceded (after X minutes of play without possession)

    • Total number of pass interceptions won

    • Total number of possession turnovers won

Tactical:

  • Attacking

    • Total number of set pieces

    • Total number of attacking corners

    • Total number of free-kicks (on the attacking third zone)

    • Total number of counterattacks (ie. based on X number of passes between possession start in own half to shot)

    • Average duration of attacking play (from possession start to shot)

    • Average number of passes per goal

  • Possession

    • Total percentage of match possession (%)

    • Total percentage of match possession in opposition's half

    • Total percentage of match possession in own half

    • Total number of possessions

    • Total number of non-shooting turnovers

    • Ratio of possessions to goals

    • Total number of passes per possession

    • Total number of long passes per possession

    • Total number of short passes per possession

  • Defensive

    • Total number of clearances

    • Total number of offsides by opponent team

    • Total number of corners conceded

    • Total number of shots conceded

    • Total number of opposition's passes in defensive third zone

    • Total number of opposition's possessions entering the defensive third zone

    • Average duration of opposition's possession

It is important to note that teams may adapt both their tactics and style of play based of the various circumstances they face in a game. For example, a team scoring a winning goal in the last 10 minutes may chose to give up possession in order to sit back in their defensive third during the remaining of the game. When using quantitative analysis to determine the success or failure again the performance indicator, it is important to take context into consideration for a more complete and accurate analysis.

The Brentford FC story: running a football club through data

In 2012, professional gambler, betting businessman and lifelong fan Matthew Benham saved Brentford FC from bankruptcy by paying the £500,000 debt the club owed. Since then, he has invested over £90 million in improving the team's training facilities, stadium and developing a youth academy that looks after every young player's academic and sporting development needs.

But aside from investing money in the club like many other club owners do, what Benham also brought to Brentford was a revolutionary analytics culture to every aspect of the club. He removed the idea that results should drive decisions, but instead use the evaluation of key performance indicators to make any recruitment decisions. When looking for his next striker, the club would now look at the number and quality of chances that player creates and how the collective performance of the team, whether it is offensively or defensively, affects the performance indicators of such player. It is by consciously doing things differently that Benham attempted to take a small club like Brentford to be able to compete at the highest level against clubs with a lot larger budgets.

Implementing a new pioneering approach to looking at the sport like the one Benham wanted for Brentford does not come easy in the world of football. Resistance of fans, and even coaches, to let go of traditional believes by holding on to the use of acquired wisdom for decision-making was something Benham had to face. In 2015, Benham sacked successful manager Mark Warburton after Warburton had won the club promotion to the Championship the prior season and the team was by then in a healthy league position. It was openly discussed that Warburton had fundamental philosophical differences with the changed structure in which Brentford FC was being run. The mathematical modeling methods that were being applied at the club, particularly in the club's scouting practices, conflicted with the football believes of a more traditional manager like Warburton.

stadium-2746118_640.jpg

As journalist Tim Wigmore clearly explained in his article for Bleacher Report in 2017, another unorthodox and tough decision Benham had to make was around the youth academy. Since 2005, no academy player had debut in the first team. Not only that, the best talent being produced by their academy was being stolen away by top clubs in the Premier League at young ages when Brentford was not due compensation for the transfer. The situation meant that the large investments being made in developing young talent were not returning any positive results to the club. This is why Brentford FC decided to completely close their academy and solely focus on recruitment from other clubs. They also created a B-team consisting of players previously rejected by other clubs and overseas players looking to trial in English football. They switched from being a feeder club of young talent into larger rivals to partnering with them for the release of the other club's surplus assets for a small fee. With a B-team as a stepping stone into the first team, the club ensure a the have a plan of succession and a place to develop talented players regardless of their age.

The approach to the recruitment of players at the club also changed. They started to follow a stock market type approach when evaluating which players should be signed, almost looking at them like appreciating and depreciating assets and taking into consideration market inflation in different countries. They aim to hire young and undervalued players that had the motivation and energy to develop further, even though that sometimes causes conflicts between short and long term planning. To do so, they employ statistical modeling to analyse player performance, particularly focusing in leagues across Europe where the markets are less inflated but player quality levels may exceed those in the Championship. 

Evaluating team performance also changed drastically at the club. Brentford are big fans of models like xG, and use those to obtain a potentially different view to the existing league table position and match results. They argue that this takes away the luck factor that can influence football results and instead looks at the quality of performances the team is having with an eye in the long term sustainability of the club. They do so to avoid the traditional rash decisions often made in football, especially around sacking a manager for a poor run of results. After the previously mentioned disagreements with Warburton, Brentford hired Dean Smith as their head coach who was fully onboard with the club's innovative philosophy and is now one of the longest-serving managers in the league.

The Telegraph also explained in 2016 how tactics and training also experienced a change in dynamics with the implementation of analytics at the club. They found that in football, teams don't pay enough attention to set piece, even though they may constitute up to a third of a team's goals. They decided to place more emphasis in these areas during trainings and even hired specialised set pieces coaches to improve on them. This resulted in a more planned approached to taking set pieces that ultimately led to more goals.

The long-term philosophy that Brentford FC have been implementing over the last 6 years generates excitement around the football analysis community that is hoping to see a club being run by analytics, sound business strategy and statistically-based decision making can make their breakthrough into the Premier League in the coming seasons. In the 2017/18 season, they were only 6 points away from promotion play-offs.

How Wyscout has evolved football scouting

Wyscout initially launched in 2004 in Italy as a Football Match Analysis and Advertising provider, amongst other minor services the company offered. It was not until 2008 when they launched their first user interface to offer access to their footballer database containing basic stats such as weight and height of players. Since then, the platform has experience rapid growth and popularity in the world of football and particular in the scouting field.

By 2012, Wyscout had captured videos and statistics of over 200,000 players around the world and was now actively being used by 300 professional clubs and 15 national sides, as reported by The Guardian newspaper right before the opening of the 2012/13 season's winter transfer window. Wyscout had established themselves in the forefront of worldwide scouting, ending with the most traditional methods historically used where scouts went to view players across the world with a notepad. With a platform like Wyscout, all the information and video footage they needed to know about their next multimillion signing or future youth academy star was as far as the click of a button.

wyscout image.jpg

However, as CEO of Wyscout Matteo Camponodico points out, the platform is not intended to replace scouts, as their roles continue to be crucial in shaping the future of clubs. Wyscout simply makes their job better by offering videos of players for them to review before or after they view them live. With the expanding range of functionalities the company continues to add, clubs can now list their transfer-listed players, examine footage of player trials, contact agents to discuss potential offers, view contract duration of players they are interested in signing and much more.

By 2016, SkySports reported that Wyscout had hire a team of 200 analyst collecting data for 1,300 matches a week and the platform had achieved a total of 32,000 professional users. With such a rapidly growing usage and user base, the demands for the data also continue to grow. Clubs asked Wyscout to go deeper into specific areas, to not only track major leagues worldwide but collect statistics in lower divisions too to sport future talent. Today, the company offers data for even semi-professional level players. The growing amount of data collected by Wyscout also increasingly requires smarter analytics to be applied to it. For example, to help digest and compare the wide variety of data offered, Wyscout develops indexing models to allow clubs to compare two team across completely different leagues using similar ratios.

Today, Wyscout is the main platform during transfer windows worldwide. The large majority of transfers in the world of football initiate and often get closed through Wyscout. But the use of the platform has also expanded to track player performance and even journalists are now using it to write articles about particular players. Even players are now making use of Wyscout to track their stats and those of their next opposition.

Matteo Camponodico's plans don't end here. He has an ambitious vision to continue the incredible growth of the platform and we are guaranteed to continue to hear a lot more about this great platform.

What are Expected Goals (xG)?

What are Expected Goals (xG)?

Expected Goals, or xG, are the number of goals a player or team should have scored when considering the number and type of chances they had in a match. It is a way of using statistics to provide an objective view to common commentaries such as: ”He shouldn't miss that!” "He's got to score those chances!" "He should have had a hat-trick!”

Goals in football are rare events, with just over 2.5 goals scored on average per game. Therefore, the historical number of goals does not provide a large enough sample to predict the outcome of a match. This means that shots on target and total number of shots are now being used as the next closest stats to predict number of goals. However, not all shots have the same likelihood of ending up in the back of the net.

This is where xG comes into play. Expected Goals uses various characteristics of the shots being taken together with historical data of such types of shots to predict the likelihood of a specific shot being scored. Since xG is simply an averaged probability of a shot being scored, a team or player may outperform or underperform their xG value. This means that they could be scoring chances that the average player would miss or that they could be missing chances that are often scored.

xG is often used to analyse various scenarios:

  • To predict the score of an upcoming match using historical data of the teams involved.

  • Assess a team’s or player’s “true” performance on a match or season, regardless of their short-term form or one-off actions on a pitch. It provides a data point on the number and quality of chances being created regardless of the final result.

  • Identify performing players in underperforming teams, or those who receive less playing minutes, by assessing which ones are more effective than the quality of their chances they receive would suggest.

  • Understand the defensive performance of a team by assessing how effectively are they preventing the opponent team from scoring their chances.

Origin of the ExpectedGoals Model

In April 2012, Advanced Data Analyst Sam Green from sport statistics company Opta first explained his innovative approach to assessing the performance of Premier League goalscorers, inspired by similar models being used in American sports. However, it was not until the beginning of the 2017/18 season when BBC’s Match of The Day debut their use of xG by their popular football pundits to make xG a focal topic of conversation by many football fans. 

Over the years, Opta has collected numerous data points of in-game actions in all of the top football leagues. When creating the xG model, Sam Green and the Opta team analysed more than 300,000 shots and a number of different variables using Opta’s on-ball event data, such as angle of the shot, assist type, shot location, the in-game situation, the proximity of opposition defenders and distance from goal. They were then able to assign an xG value, usually as a percentage, to every goal attempt and determine how good a particular type of chance is. As new matches are played new data is collected to continuously refine the xG model.

There is no one specific model to calculate xG. When looking at xG it is important to consider that the xG value would depend on the factors that the analyst creating the xG model wants to incorporate in the calculations. Since its release to the public, the xG theory raised considerable attention in the analytics community, with many enthusiasts working and adjusting the model in their own ways in an attempt to perfect it. This means there are now several different xG models out there, each of them considering different factors. Some would consider whether it was a goal scored with their feet or with their head, other consider the situation that led to the shot and so on, but the final prediction each model outputs have shown to only vary slightly across different models.

How is xG calculated?

Opta’s xG model is based on the fact that the most basic requirement to score goals is to take shots. However, not all strikers score goals from the same number of shots. As Sam Green identified, in the 2011/12 season Van Persie only needed 5.4 shots to score a goal, while Luis Suarez took 13.8 shots for each goal he scored. However, they both shot the same number of times per game they played.

Cross

This is why Opta decided to look deeper into the quality of chances each striker received by adding the average location from which each shots was taken. However, they soon realized that location on its own was not enough. A penalty spot chance could come from a penalty kick, a header from a corner or a 1 on 1 against the goalkeeper, each with a very different likelihood of ending up in a goal. That is why Opta decided to incorporate additional data points to the model. Unfortunately, the exact model with all the factors considered by Opta has not been made public but a number of analyst have attempted to replicate or improve the model since its first release.

The xG model was designed to return an xG value for each player, team or chance depending on the dimension that the data is being analysed in: a full season, a particular match, a specific half in a game or group of goal attempts. Let’s say a player like Harry Kane takes 100 shots from chances that, based on historical Premier League data, have a probability of being scored of 0.202 (or 20.2%). Kane's xG value would be 20 expected goals scored (100 shots x 0.202). This xG number would contain an average of some ‘big scoring chances’ Kane took, such as penalties with 0.783xG, other non-penalty shots inside the box with varying xG values such as 0.387xG and maybe even shots outside the box with an 0.036xG value. The models attempts to balance the number of shots a player takes with the quality of these chances. For example, a player may get himself into very dangerous attacking positions inside the box in 23 occasions with high xG value and score the same number of goals than a player that continuously tries his luck from outside the box with 81 shots attempts that have a lower xG value.

Once an xG value has been calculated, a player or team’s performance can be evaluated on whether they are over or under-performing such value. In the above example, Harry Kane may actually score 25 goals during the full season, 5 goals above his 20 xG value, suggesting that his ability of converting chances is above-average and he can find the net in difficult scoring situations. Similarly, a player with a 20 xG value who has scored 15 goals suggests that he is missing chances that he probably should have scored.

Goalkeeper

Opta took xG a step further and assessed the impact the player had to a specific chance using their shot quality. They did so by factoring into the xG calculation the propensity to hit the target a shot taken by the player has and then comparing the former xG(Overall) value against this new xG(On Target) one. Their analysis showed that at the time Van der Vaart’s shooting saw his xG increase from 6.9xG to 10.3xG(On Target), suggesting that the type of shots he took were of higher quality than the average when xG was calculated before he took the shot. xG(OT) when compared to actual goals may also indicate how much a player was affected by the quality of goalkeeping he had to face. In the same season, Mikel Arteta scored 7 goals with just 3.5xG(OT) suggesting he got ‘luckier’ in front of goal as his shooting quality should have only given him just over 3 goals.

xG(OT) can be used to assess goalkeeping quality when used in reverse. Since it only takes into consideration shots on target, a keeper’s participation in these sort of chances is crucial to the final outcome of the play. De Gea conceding 22 goals with an 27xG(OT) suggests that he has blocked goals in situation were they are normally conceded.

Why are Expected Goals important in today's football?

Luck and randomness influences results in football more often than any other sports. We have all seem teams being dominated throughout a match and manage to score a last minute winning goal while having a lower number of chances than their opposition. But how sustainable is that? We have also seen world class strikers become out-of-form and spend a few games without seeing the back of the net. Is the player not taking advantage of the chances being provided by his teammates? xG allows us to assess the process over the results of a match, or performance of a player or team, by rating the quality of chances instead of the actual outcome.

football-1274661_1280.jpg

The most used example to explain xG’s efficiency is the Juventus season of 2015/16. Juventus only won 3 out of their first 10 games but the difference between their actual goals and xG was considerably high. This meant that the had the chances but were not converting them, suggesting that their negative run of results might not last if they just get a bit luckier in front of goal. Sacking manager Massimo Allegri could have been a mistake, since after match day 12 their luck changed and ended up winning the league title with 9 games spare.

xG gives us a more accurate way of predicting match outcomes than by simply using individual stats. In the Premier League, only 71.6% of teams that had the most shots won the fixture, while close to 81% of teams that obtain a higher xG score win games. It eliminates historical assumptions that popular tradition in football has created and provides a statistically relevant point of argument to whether the performance of a player or team is above or below the average given a number of historical data points.

garry-mendes-rodrigues-2846045_1280.jpg

When using expected goals to see which players are hitting the target more or less than the numbers suggest they should, teams can scout promising prolific goalscorers if they consistently score more goals than the quality of chances they get. On the other hand if a player surpasses his expected goals for a few games but has no history of doing so in the past, it might come down to his form and luck rather than goalscoring talent, and he might struggle to sustain that over a long period of time.

Limitations of the Expected Goals model

The xG model is only as good as the factors being input into its calculations. These data inputs are limited by the data we possess today from companies such as Opta. Other factors, such as shot power, curl or dip on the shot or whether the goalkeeper is unsighted or off balance might not be considered in most xG models out there. Due to model being based on averages, the random nature of a football match and the rarity of goals in the sport makes it almost impossible to consider with enough statistical significance all historical factors that can cause a goal to be scored. xG should be used as indicative and supportive information for decision making purposes and generating opinions rather than a finite answer to the performance of a team or player.

As the model’s creator Sam Green puts it: “a system like this will also fail to predict a high scoring game. Since it is based on averages and with around half of matches featuring fewer than 2.5 goals, this is to be expected”. We also need to consider that a shot taken by a Manchester United striker should have a higher xG than one taken by a Stoke City player, suggesting that on average Man Utd would outperform their xG on a chance by chance basis while Stoke City would underperform it if the xG is calculated using averages from all English teams' shot history.

Criticism and the Future of xG models

The recent misuse of Expected Goals as a analysis metric during pundit commentary has encouraged numerous criticism. A team may score one or two difficult chances early in a game and sit back for the remaining of the 90 minutes, allowing their opponents to take many shots from different positions, thus increasing the opponents xG. One could then claim that the losing team achieved a higher xG therefore deserves the win. This is why xG should always be taken with additional context of the game before creating a verdict. Statistics can just tell us what happened in a game but a wider view is necessary to show you how it happened and give you a clearer idea on what’s yet to come. Certain in-game actions by players cannot be measured with a statistical model today, such as the ability of a defender in getting in front of a shot attempt despite never touching the ball.

There is also a strong resistance from the football community to the use of data. Football is a traditional and emotional sport by nature, with experience and accepted wisdom dominating people’s opinions. Most fans see the use of statistics as intrusive and challenging their popular and historic knowledge of “the beautiful game”. After experiencing their team lose, most of them are not interested in listening to television pundits discuss how their team performed against their expected goals. Despite analytics having plenty to offer to football performance analysis, there are still doubters. xG’s debut in Match of the Day shaked social media with instant mentions of “stat nerds” and claims that the numbers in football are “pointless” and “bollocks”. However, it has been made clear by Opta that xG is not intended to ever replace scouts and pundits but simply aid them in their analysis of a game.

Despite all this resistance and criticism by some pundits and football fans to accept this new era of football analysis, Opta and various sport analysts continue to evolve the use of statistics to analyse performance in numerous areas in football. Models such as xG are the first round of statistical systems and will soon be followed by upcoming ones such as Defensive Coverage, which will assess tackles, blocks, interceptions, man-marking and clearances. Football’s data revolution has started and will continue to see developments every season.