
One of the most important tactical decisions made in football is deciding on the best team formation, determining what roles each player has and the playing style. Laurie Shaw and Mark Glickman from the Department of Statistics at Harvard University recently developed an innovative, data-driven way of identifying different tendencies seen by managers when giving tactical instructions to their players, specifically around team formations. They measured and classified 3,976 observations of different spatial configurations of players on the pitch for teams with and without the ball. They then analysed the changes of these formations throughout the course of a match.
While team formations in football have evolved over the years, they continue to heavily rely on a classification system that simply counts the number of defenders, midfielders and forwards (i.e. 4-3-3). However, Laurie and Mark argued that this system only provides a crude summary of player configurations within a team, ignoring the fluidity and nuances these formations may experience during specific circumstances of a match. For instance, when Jürgen Klopp prepares his formations at Liverpool, he creates a defensive version where all players know their roles and an offensive one that aims to exploit the best areas of the pitch. Therefore, Liverpool prepare different formations for different phases of the game; a detail that is lost when describing them as using a simple 4-3-3 formation.
Identifying Defensive And Offensive Formations
The researchers used tracking data to make multiple observations of team formations in the 100 matches analysed; separating formations with and without possession. By doing so, they identified a unique set of formations that are most frequently used by teams. These groups helped them classify new formation observations to then analyse major tactical transitions during the course of a match.
Source: Shaw, L. & Glickman, M. (2019) Dynamic analysis of team strategy in professional football. Barça Sports Analytics Summit.
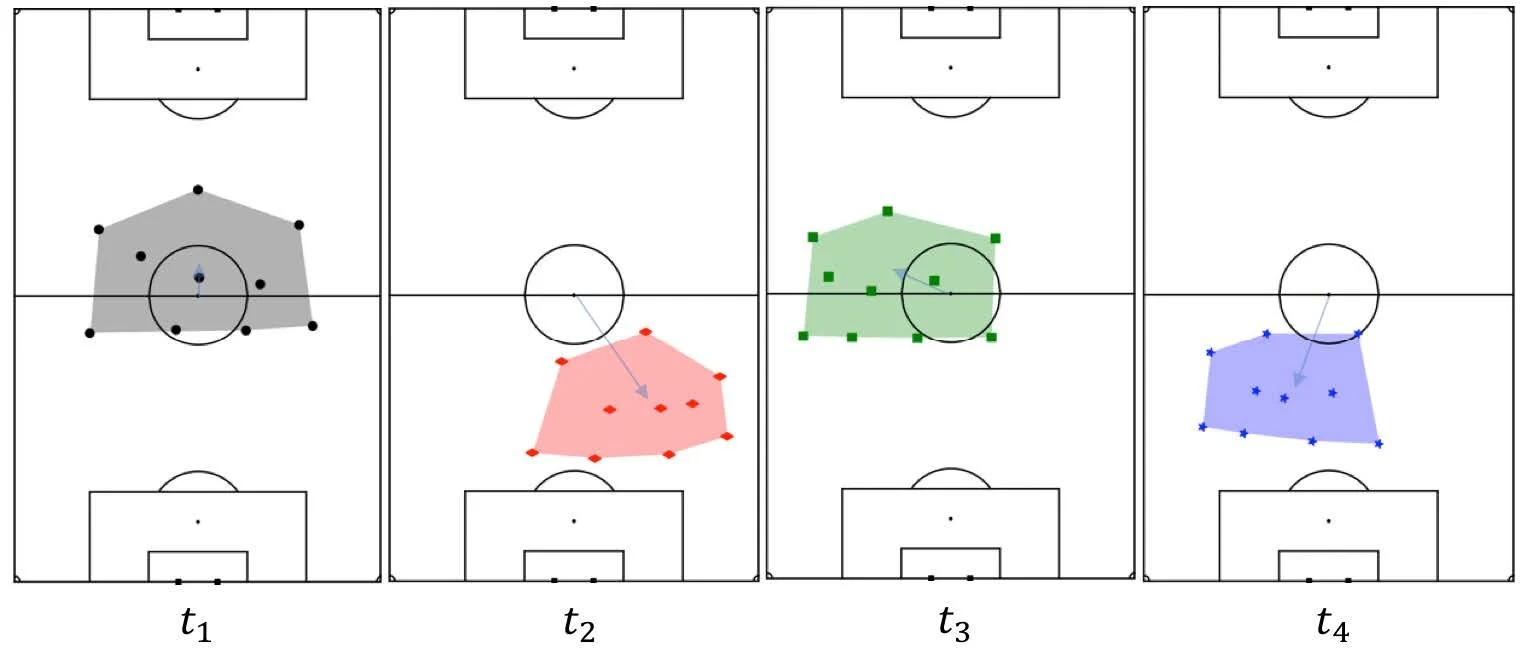
The above diagram from Laurie and Mark’s study shows a defending team moving as a coherent block by having players retain their relative position, showing that their formation is not defined by the positions of players on the pitch in absolute terms but by their positions relative to one another. Starting from the player in the densest part of the team, Laurie and Mark calculated the relative position of each player using the average angle and distance between said player and his nearest neighbour over a specific time period in a match, and subsequently repeating the same process with the latter’s neighbor and so on. By calculating the average vectors between all pairs of players in the team, they obtained a center of mass of a team’s formation, which is then aligned to the centre of the pitch when plotting team formations.
Source: Shaw, L. & Glickman, M. (2019) Dynamic analysis of team strategy in professional football. Barça Sports Analytics Summit.
The researchers made multiple observations of a team’s defensive and offensive configurations throughout the match. They aggregated together the observed possession into two-minute intervals. For example, for the team in possession they plotted all possessions into two-minutes time periods and then measured their formations in each of those sets, and did the same process for the team without possession during the same time period.
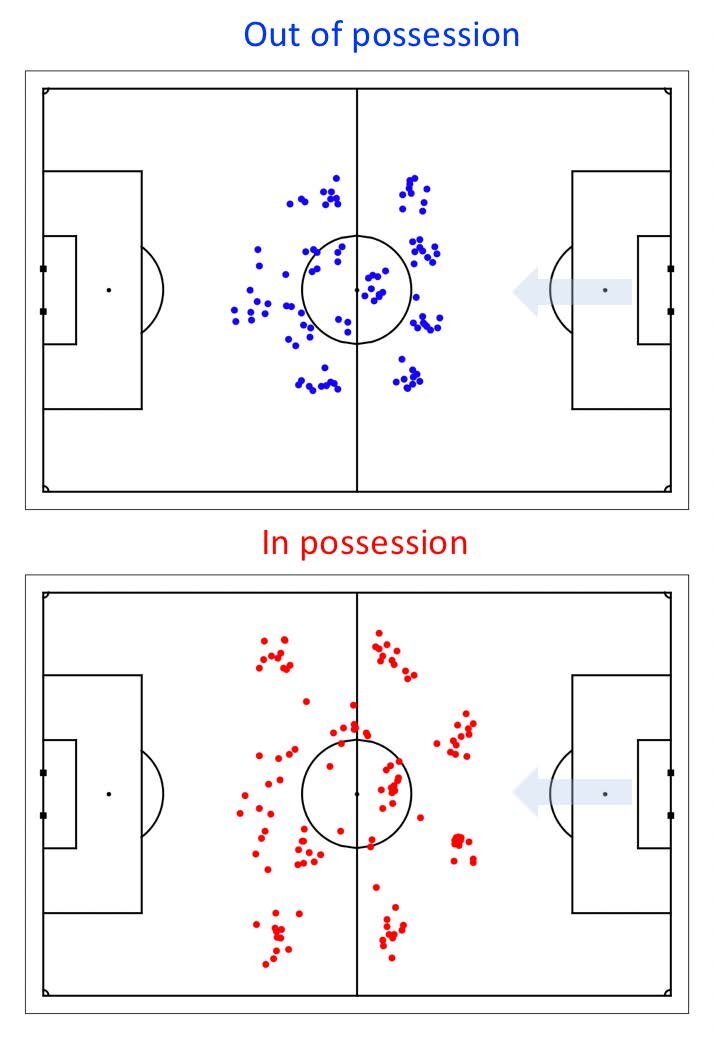
The diagram below shows a set of formation observations for a team during a single match, illustrating that the team defends with a 4-1-4-1 formation, but attacks with three forwards and with the fullbacks aligning with the defensive midfielder. These findings also illustrate that while the defensive players remained compacted, the movement of attacking players, such as central striker was more varied. The consistency in all the observations also suggest that the managers did not change formations significantly during the match.
Source: Shaw, L. & Glickman, M. (2019) Dynamic analysis of team strategy in professional football. Barça Sports Analytics Summit.
Grouping Similar Formations Together Into Five Clusters
Additionally, Laurie and Mark used an agglomerative hierarchical clustering to identify unique sets of formations that teams used in the 100 matches analysed; constituting 1,988 observations of defensive formations and 1,988 observations of offensive ones. To be able to group formations together, they first had to define a metric that established the level of similarity between two separate formations. The similarity between two players in two different formations is quantified using the Wasserstein distance, using their two bivariate normal distributions, with their own means and covariance matrix, where the Wassertein distance between them is calculated by squaring the L2 norm of the difference between their means. However, an entire team’s formation consists on a set of 10 bivariate normal distributions, one for each outfield player. Therefore, to compare two different team formations the researchers calculated the minimum cost of moving from one distribution to another using the total Wasserstein distance. The blue area in the diagram below indicates the number of players that deviate from the formation’s average position.
Laurie and Mark also found that two formations may be identical in shape, but one may be more compact than the other. In order to classify formations solely by shape and not by their degree of expansion across the pitch, they had to scale the formations so that compactness is no longer a discriminator in their clustering.
Once this was resolved, the hierarchical clustering applied to the dataset simply found two most similar formation observations based on the Wasserstein distance metric to combine them and form a group. Then, it found the next two most similar ones, forming more groups, and so on. This process identified 5 groups of formations with each group containing 4 variant formations, producing a total of 20 unique formations.

Source: Shaw, L. & Glickman, M. (2019) Dynamic analysis of team strategy in professional football. Barça Sports Analytics Summit.
The first group of formations correspond to 17% of all observations in the sample of Laurie and Mark’s study. The commonality of these four variants in the first group of formations is that there are five defenders, but with variations in the number of midfielders and forwards. This group of formations was most predominant in defensive situations, with between 73%-88% of their observations being of teams without possession.


Source: Shaw, L. & Glickman, M. (2019) Dynamic analysis of team strategy in professional football. Barça Sports Analytics Summit.
Group 2 and Group 3 share the commonality of having 4 defenders, with group two in the second row consisting of more compact midfields, as oppose to a more expanded midfield in Group 3 formations.

Source: Shaw, L. & Glickman, M. (2019) Dynamic analysis of team strategy in professional football. Barça Sports Analytics Summit.
Group 4 contained predominantly attacking formations consisting on three defenders, where the wingbacks push high up the pitch, and with variations in structure of the midfield and forward line.

Source: Shaw, L. & Glickman, M. (2019) Dynamic analysis of team strategy in professional football. Barça Sports Analytics Summit.
Group 5 formations contained two defenders with fullbacks pushed up the field and with some variations in the forward line with either two or three forwards, as well as different structures on the midfield. These group of formations consistent entirely in offensive formations observations.
As illustrated by these groupings, the hierarchical clustering Laurie and Mark applied was very efficient in separating offensive and defensive formation observations, even after excluding the dimension of the area of the formation (i.e. how compact the formations are) as a discriminator. Additionally, while some of these formations aligned with traditional ways to describe formations, such as 4-4-2 or 4-1-4-1, others do not clearly fall within these historical classifications. Once the formation clusters were identified, the researchers developed a basic model selection algorithm to categorise any new formation observations into any of these groups by finding the maximum likelihood cluster.
Transitions Between Offensive And Defensive Formations
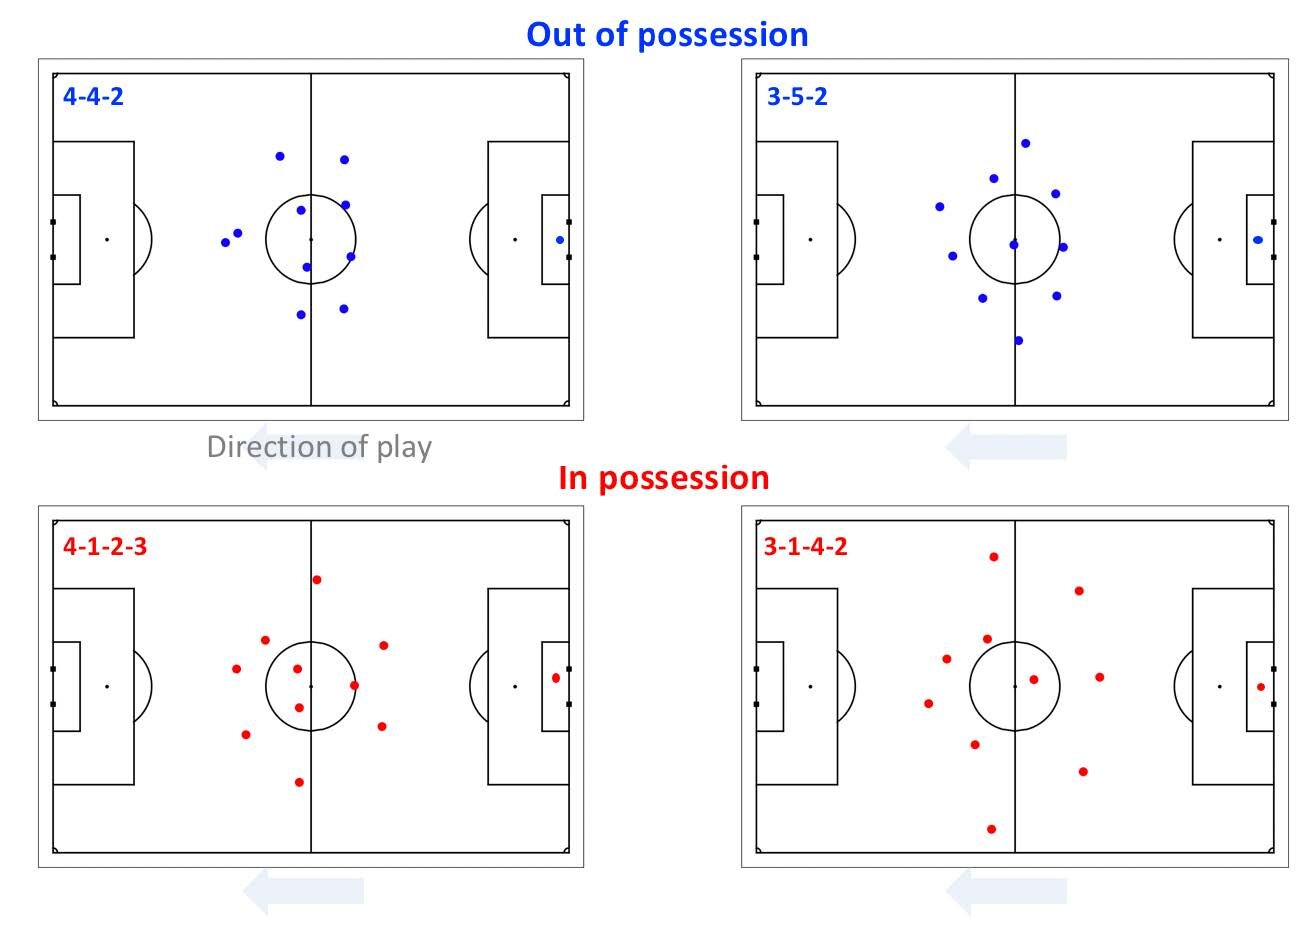
Laurie and Mark took their research a step forward by evaluating the pairing tendencies by coaches of the various defensive and offensive formations. In the diagram below, they illustrated that the teams that defend with Cluster 2 frequently transition into an offensive formation like the one in Cluster 16, with the wingbacks pushing up. Also, half of the teams with the defensive formation in Cluster 9 tend to use the offensive formation in Cluster 10, while the other half transition to a formation similar to Cluster 18. This demonstrated a clear story in to how a player transitions from their defensive role to their attacking role. Moreover, it showed that some defensive formations allow more variety in terms of the offensive formations than others.

Source: Shaw, L. & Glickman, M. (2019) Dynamic analysis of team strategy in professional football. Barça Sports Analytics Summit.
Tactical Match Analysis Through This Methodology
The methodology developed by Laurie and Mark allows teams to measure and detect significant changes in formations throughout the match. They were able to produce diagrams such as the one below to illustrate the formation changes in both defensive (diamonds) and offensive (circles), including annotations of goals (top lines) and substitutions (bottom lines). The story of the match in the diagram shows a red team conceding a goal in the first half and then making a significant tactical change at half time as well as a substitution. Laurie and Mark found this situation very usual, as whenever there was a major tactical change it was often accompany with a substitution. Comparing with other matches, they found that this particular red team made major tactical changes at half time in around a quarter of their matches, providing insights into how their manager reacts to given situations.

Source: Shaw, L. & Glickman, M. (2019) Dynamic analysis of team strategy in professional football. Barça Sports Analytics Summit.
In another diagram, they demonstrated how their methodology can also help study how changes in formation begin impact the outcome of a match. In this match, the blue team were predominantly attacking down the wings in the first half, with most of their high quality opportunities coming from right wing. In the second half, the red team changed their formation to five defenders instead of four, which reduced the attacks from the blue team’s right wing and instead going through the centre, presumably less busy since they now have two midfielders rather than three.

Source: Shaw, L. & Glickman, M. (2019) Dynamic analysis of team strategy in professional football. Barça Sports Analytics Summit.
Finally, this methodology also allows teams to establish the link between chance creation and formation structure. They can also measure how different the position of opposing players is from their preferred defensive structure (i.e. how are are they out of position). At the same time, it allows for the measurement of the level of attacking threat by assessing the amount of high value territory the attacking team controls near the defending team’s goal. These pitch control models enable the measurement of threatening positions even when no shot took place. Laurie and Mark suggest that this kind of analysis allows teams to better understand how the attacking team maneuvers defenders out of their positions or how they take advantage defending team being out of position after a high press or a counterattack.
Citations:
Shaw, L. & Glickman, M. (2019) Dynamic analysis of team strategy in professional football. Barça Sports Analytics Summit. Link to paper